2025 Sailing Report
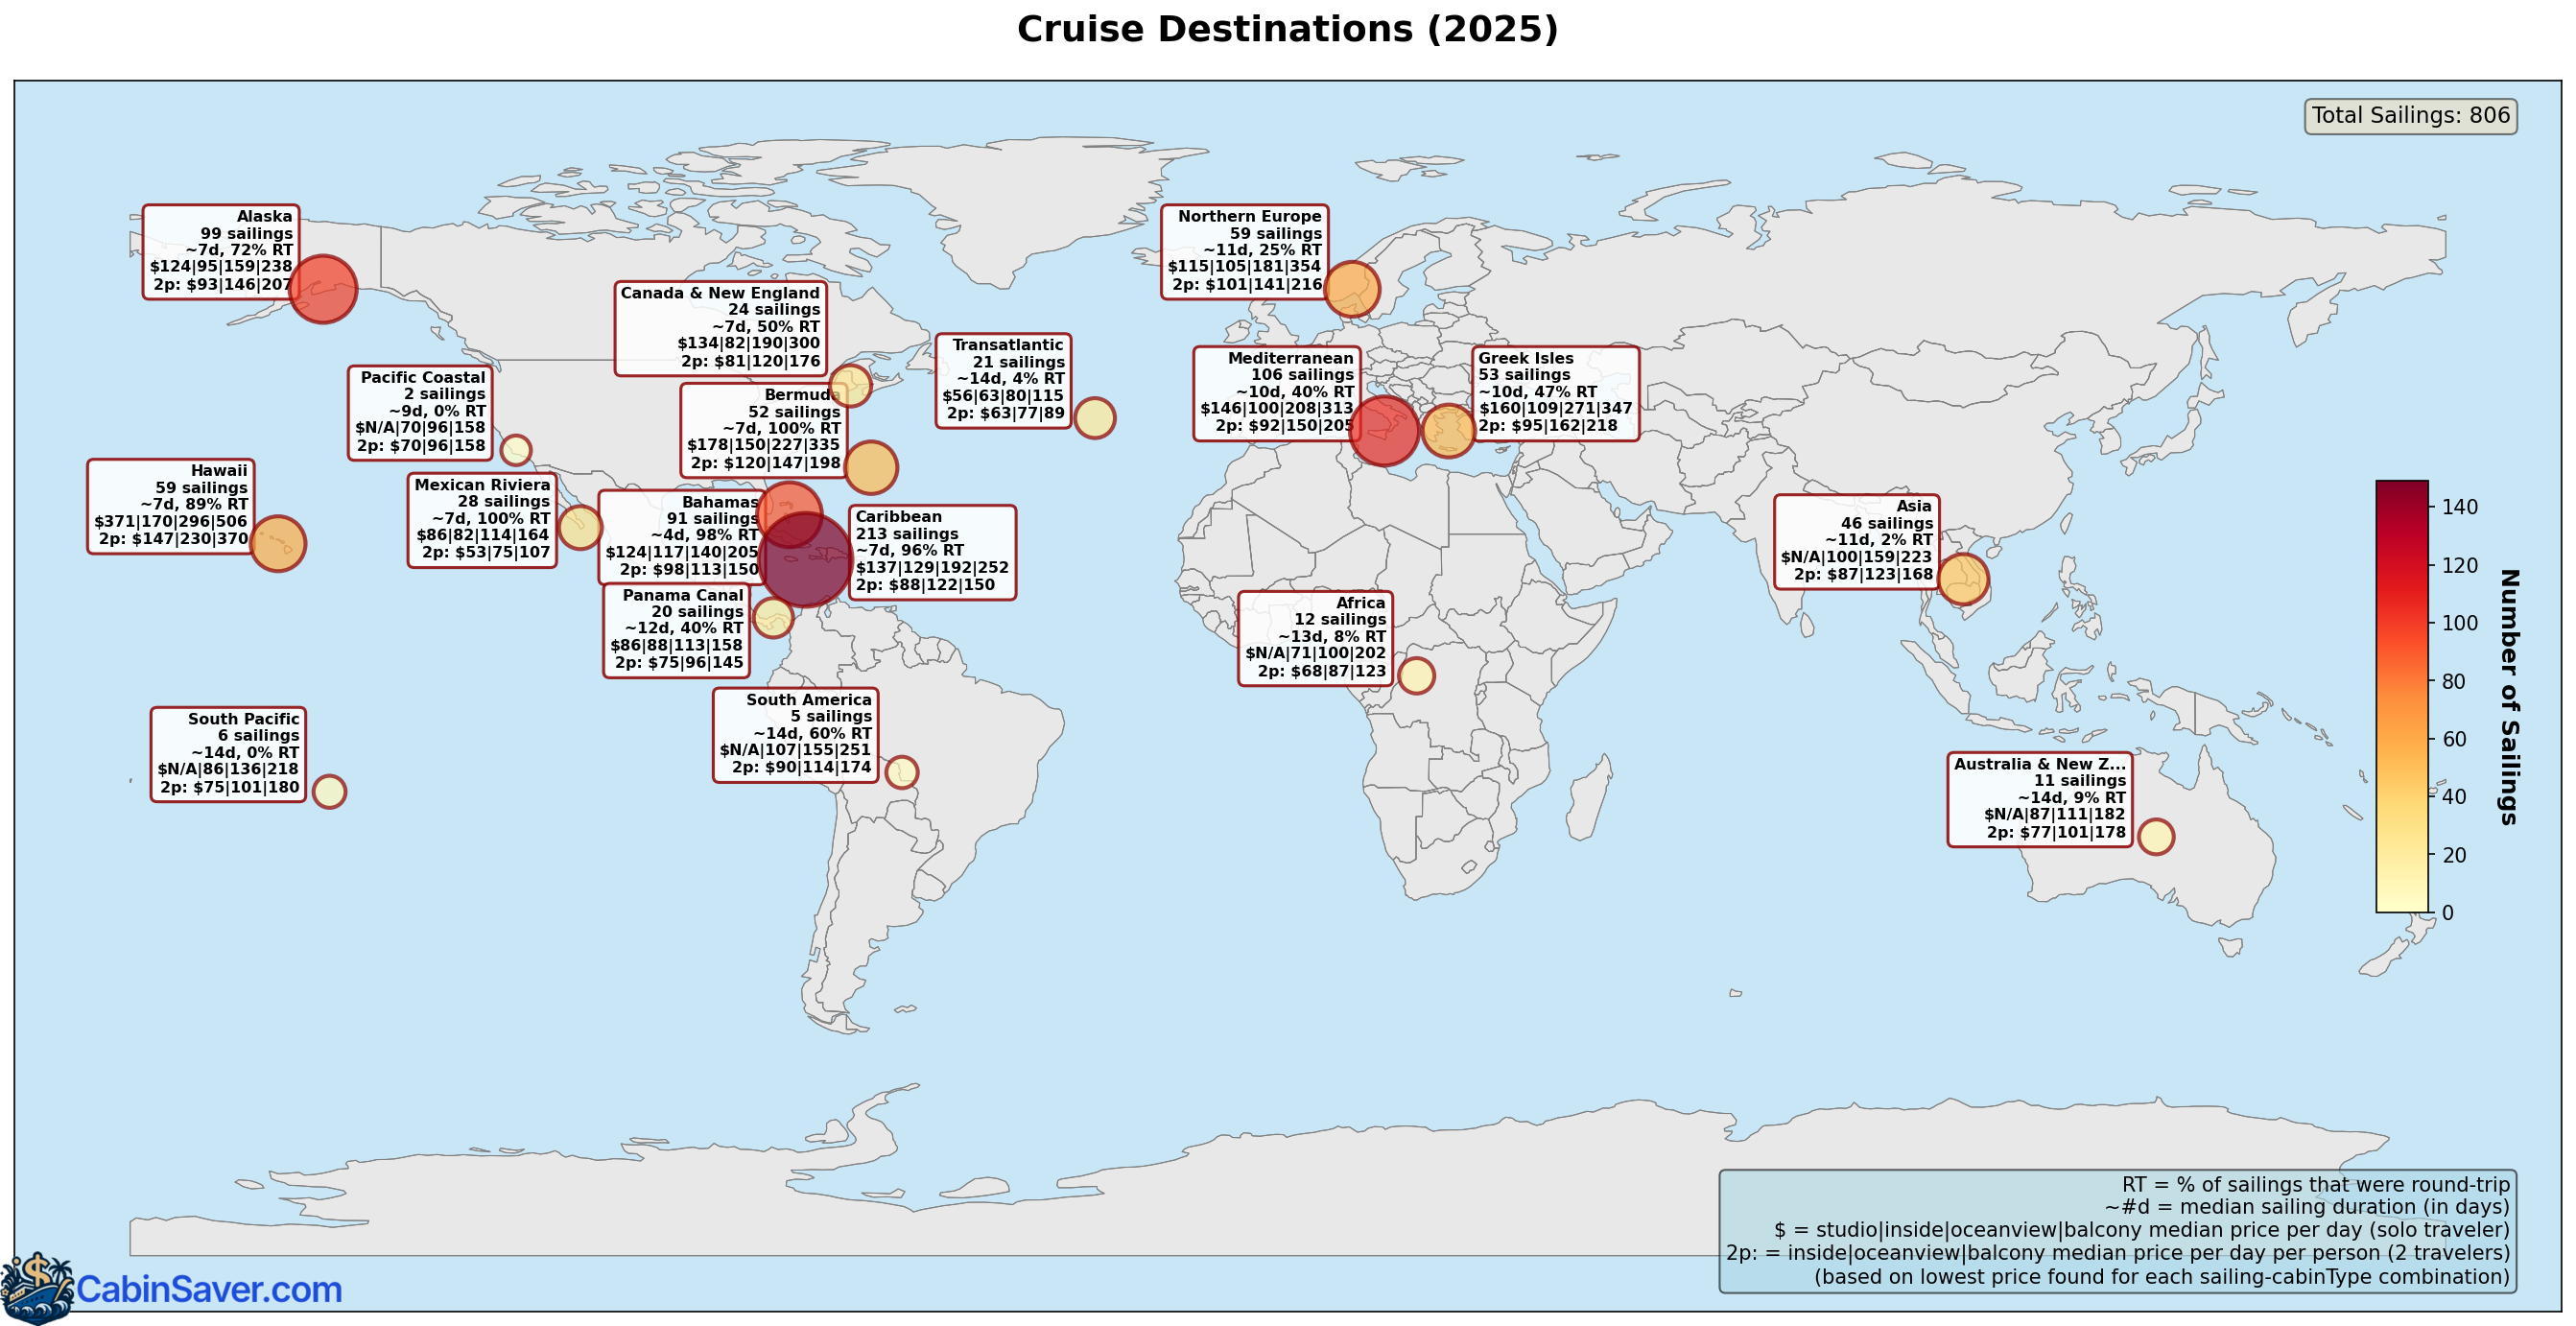
Table of Contents
- Information about the dataset
- Cruise destinations
- Embarkation ports
- Popular ports of call
- Pricing
- Sailing durations
- Frequently Asked Questions
Information about the dataset
Data Source Disclaimer: The analysis and visualizations in this report are based on publicly available Norwegian Cruise Line sailing data collected from 2023 through 2025. All statistics, trends, and insights represent our independent analysis of this data and are provided for informational and educational purposes only. We make no guarantees about the accuracy, completeness, or reliability of this analysis. Cruise schedules, prices, and availability are subject to change. This report should not be used as the sole basis for booking decisions. For current sailing information and bookings, always verify directly with the cruise line's official website and/or authorized travel agents. We are not liable for any decisions made based on this information.
The below charts are based on a dataset that consist of:
- NCL sailings that departed in 2025.
- Note: rescheduled/canceled itineraries have been removed from the dataset to the best of my ability.
- Cabin pricing based on:
- Base fare for solo (1-person) guest occupancy.
- The lowest prices found for each sailing's cabin type (since prices fluctuate, and CabinSaver focuses on deals).
- Cruise-only packages (excludes land tours).
- Non-premium cabins (balcony and below).
- Publicly available sailing information collected from December 2023 through December 2025.
Cruise destinations
The Caribbean was the most popular destination with 213 sailings throughout the year, followed by the Mediterranean with 106 sailings (concentrated in summer months) and Alaska with 99 sailings (primarily May-September). The Bahamas and Hawaiian islands also saw significant sailing volume.
Note: some sailings visited multiple destinations, so the sum of all individual regions exceeds the total sailing count.
Destination popularity by month
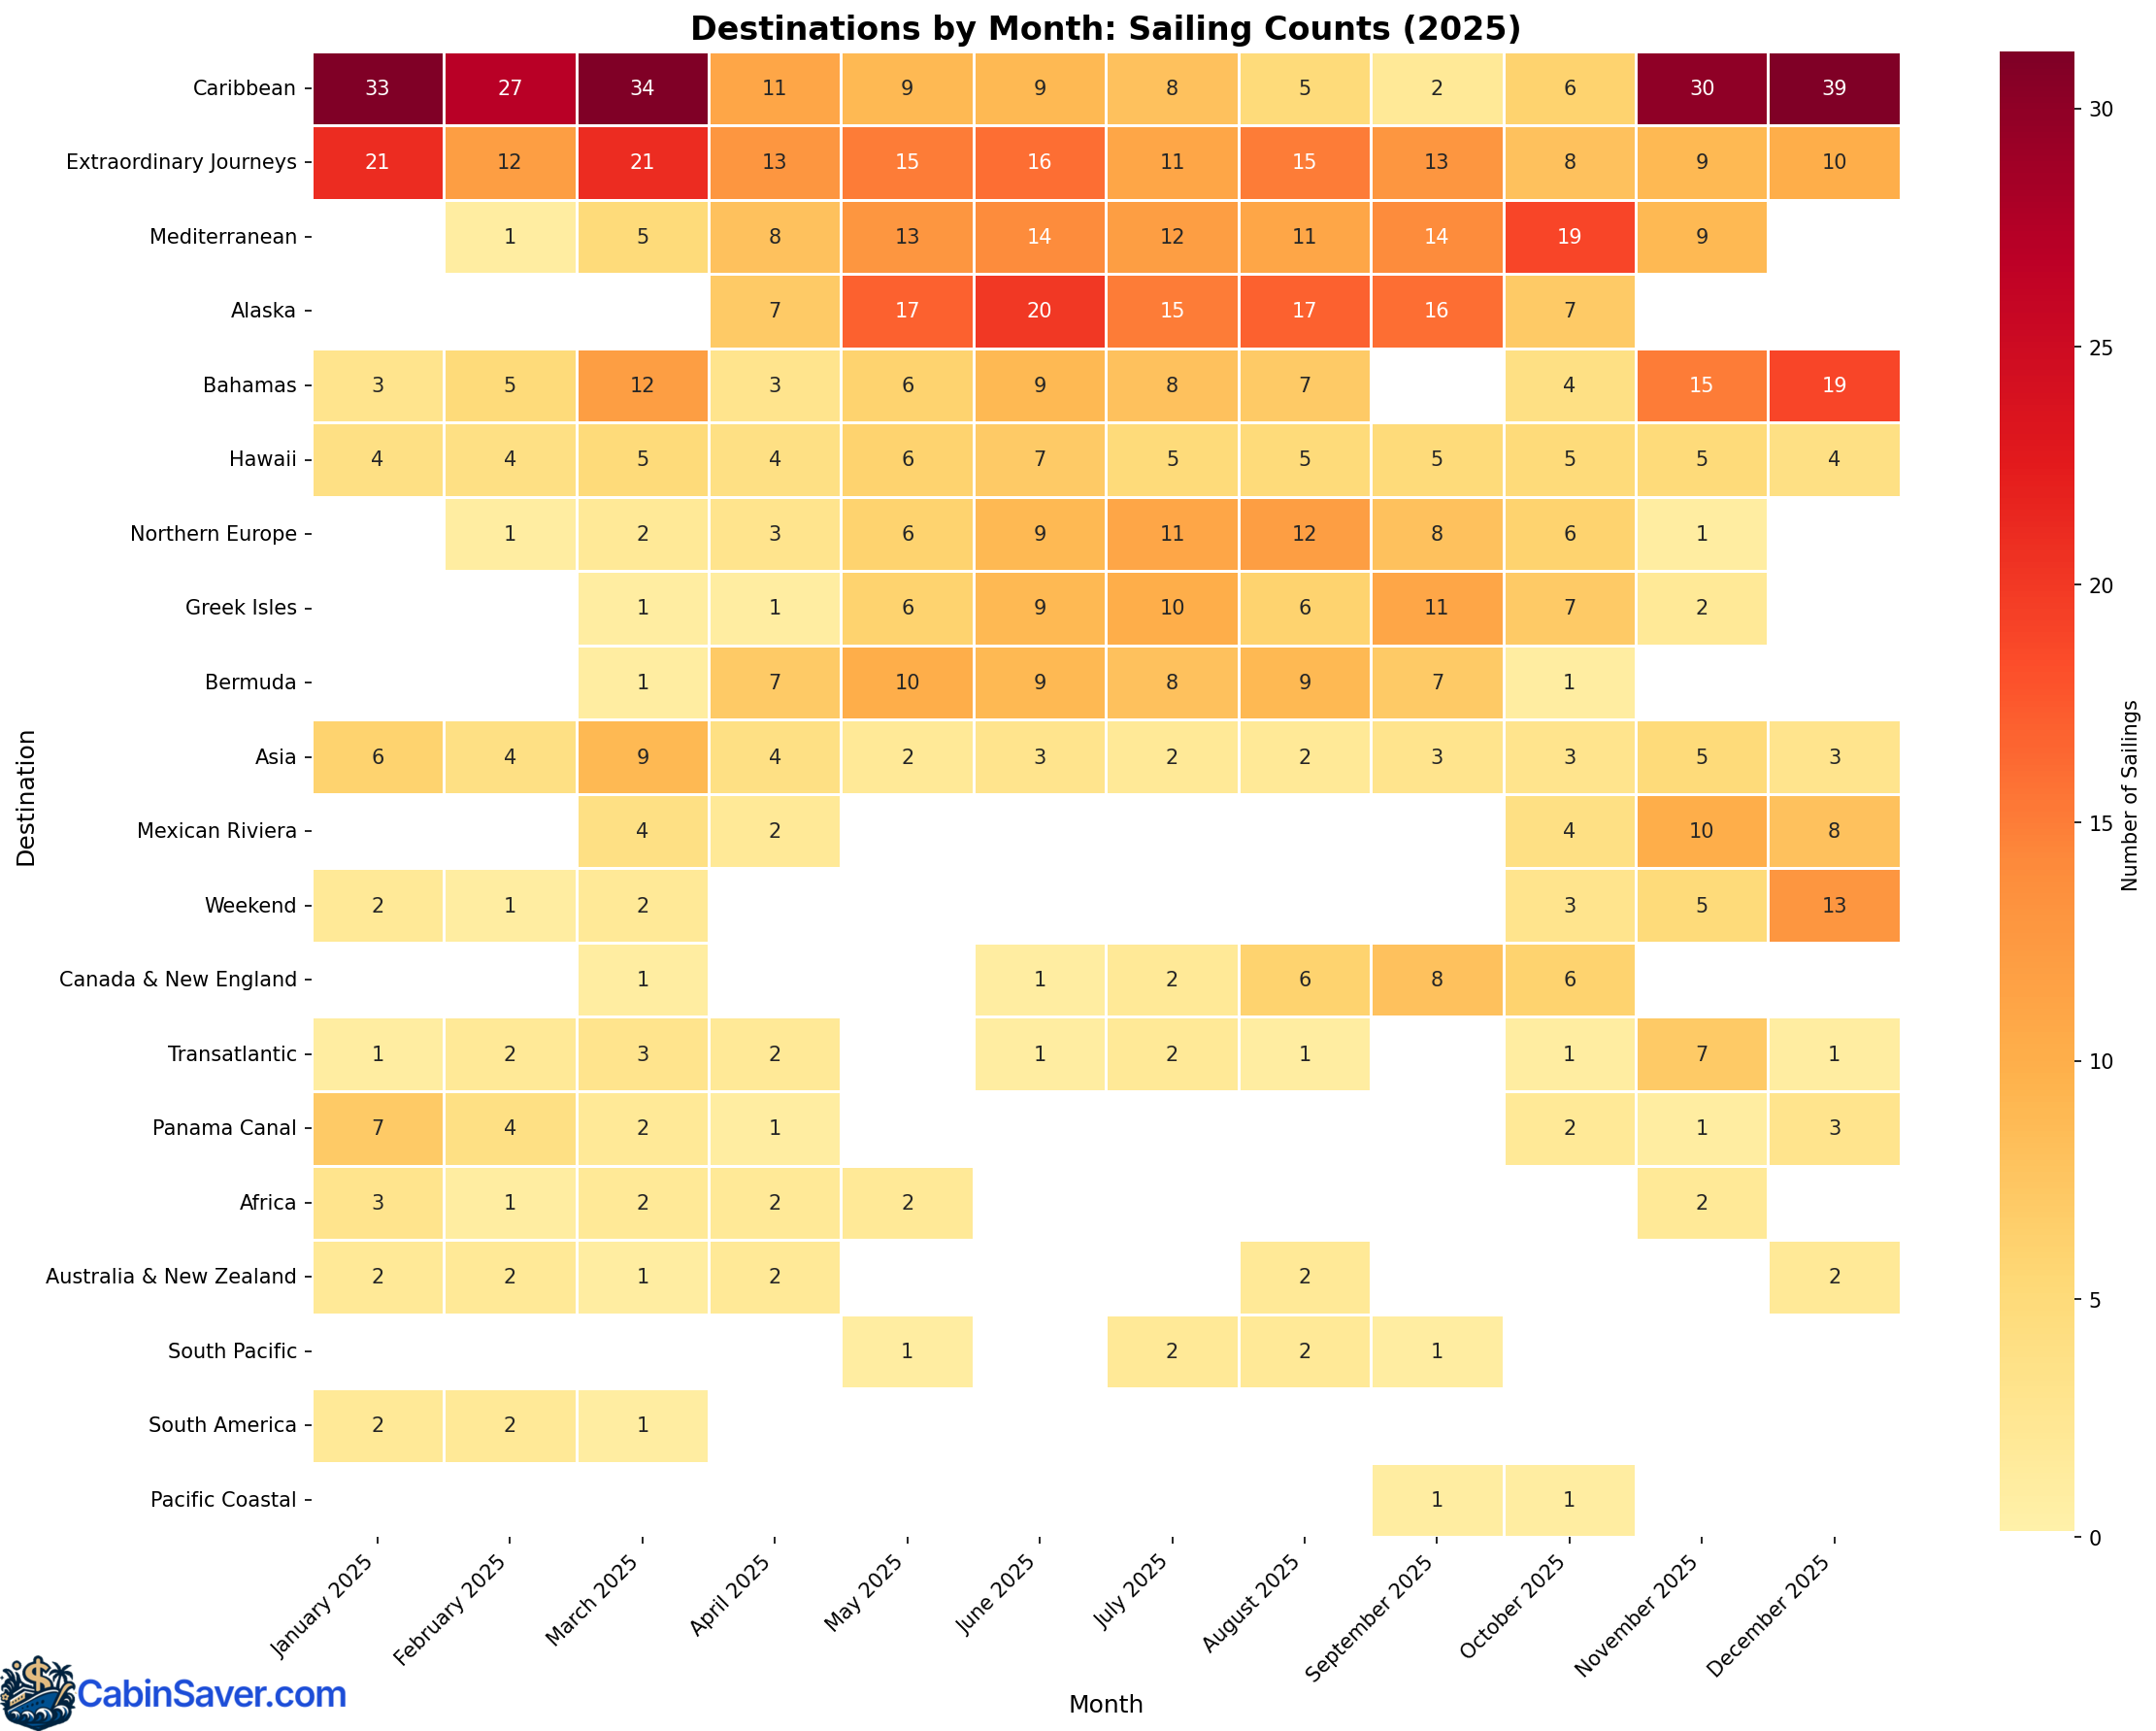
Caribbean sailings were available year-round with a spike from November through March. Alaska shows strong concentration from May through September.
Detailed pricing by destination
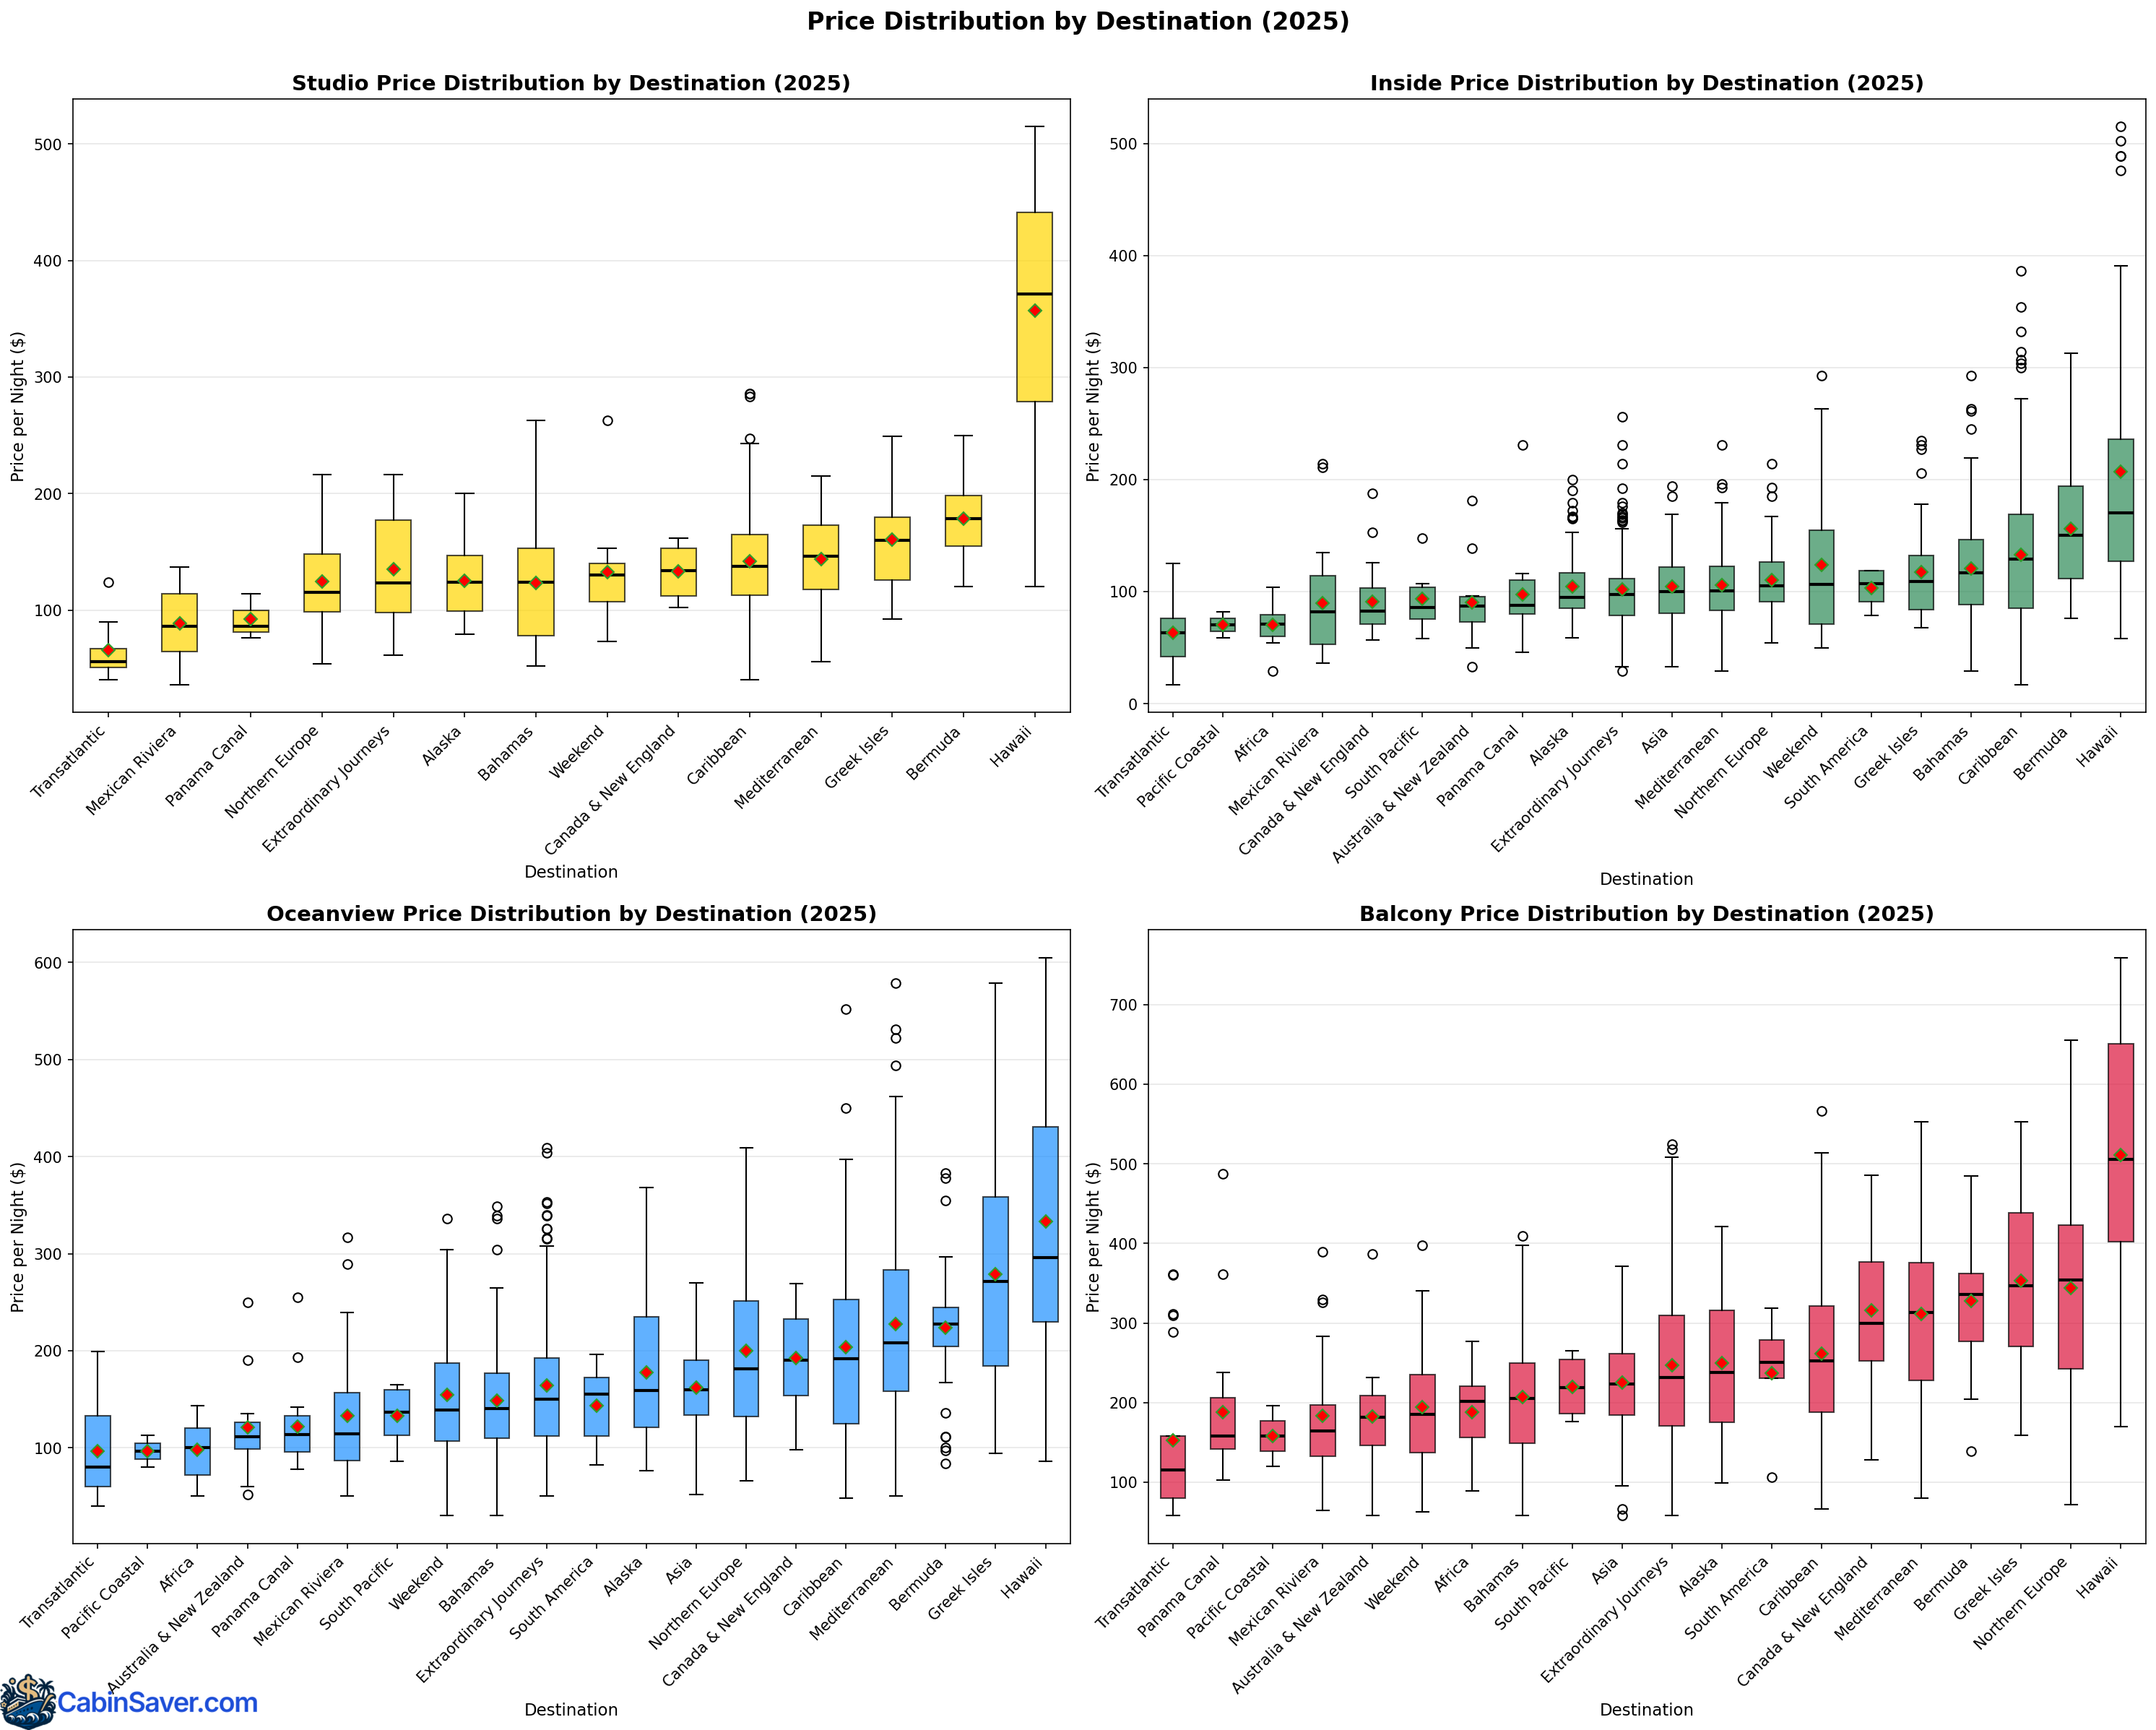
Hawaii commanded premium pricing. Transatlantic and Panama Canal itineraries offered budget-friendly options, likely because they are primarily repositioning cruises (non-round-trip).
Destination pricing by month
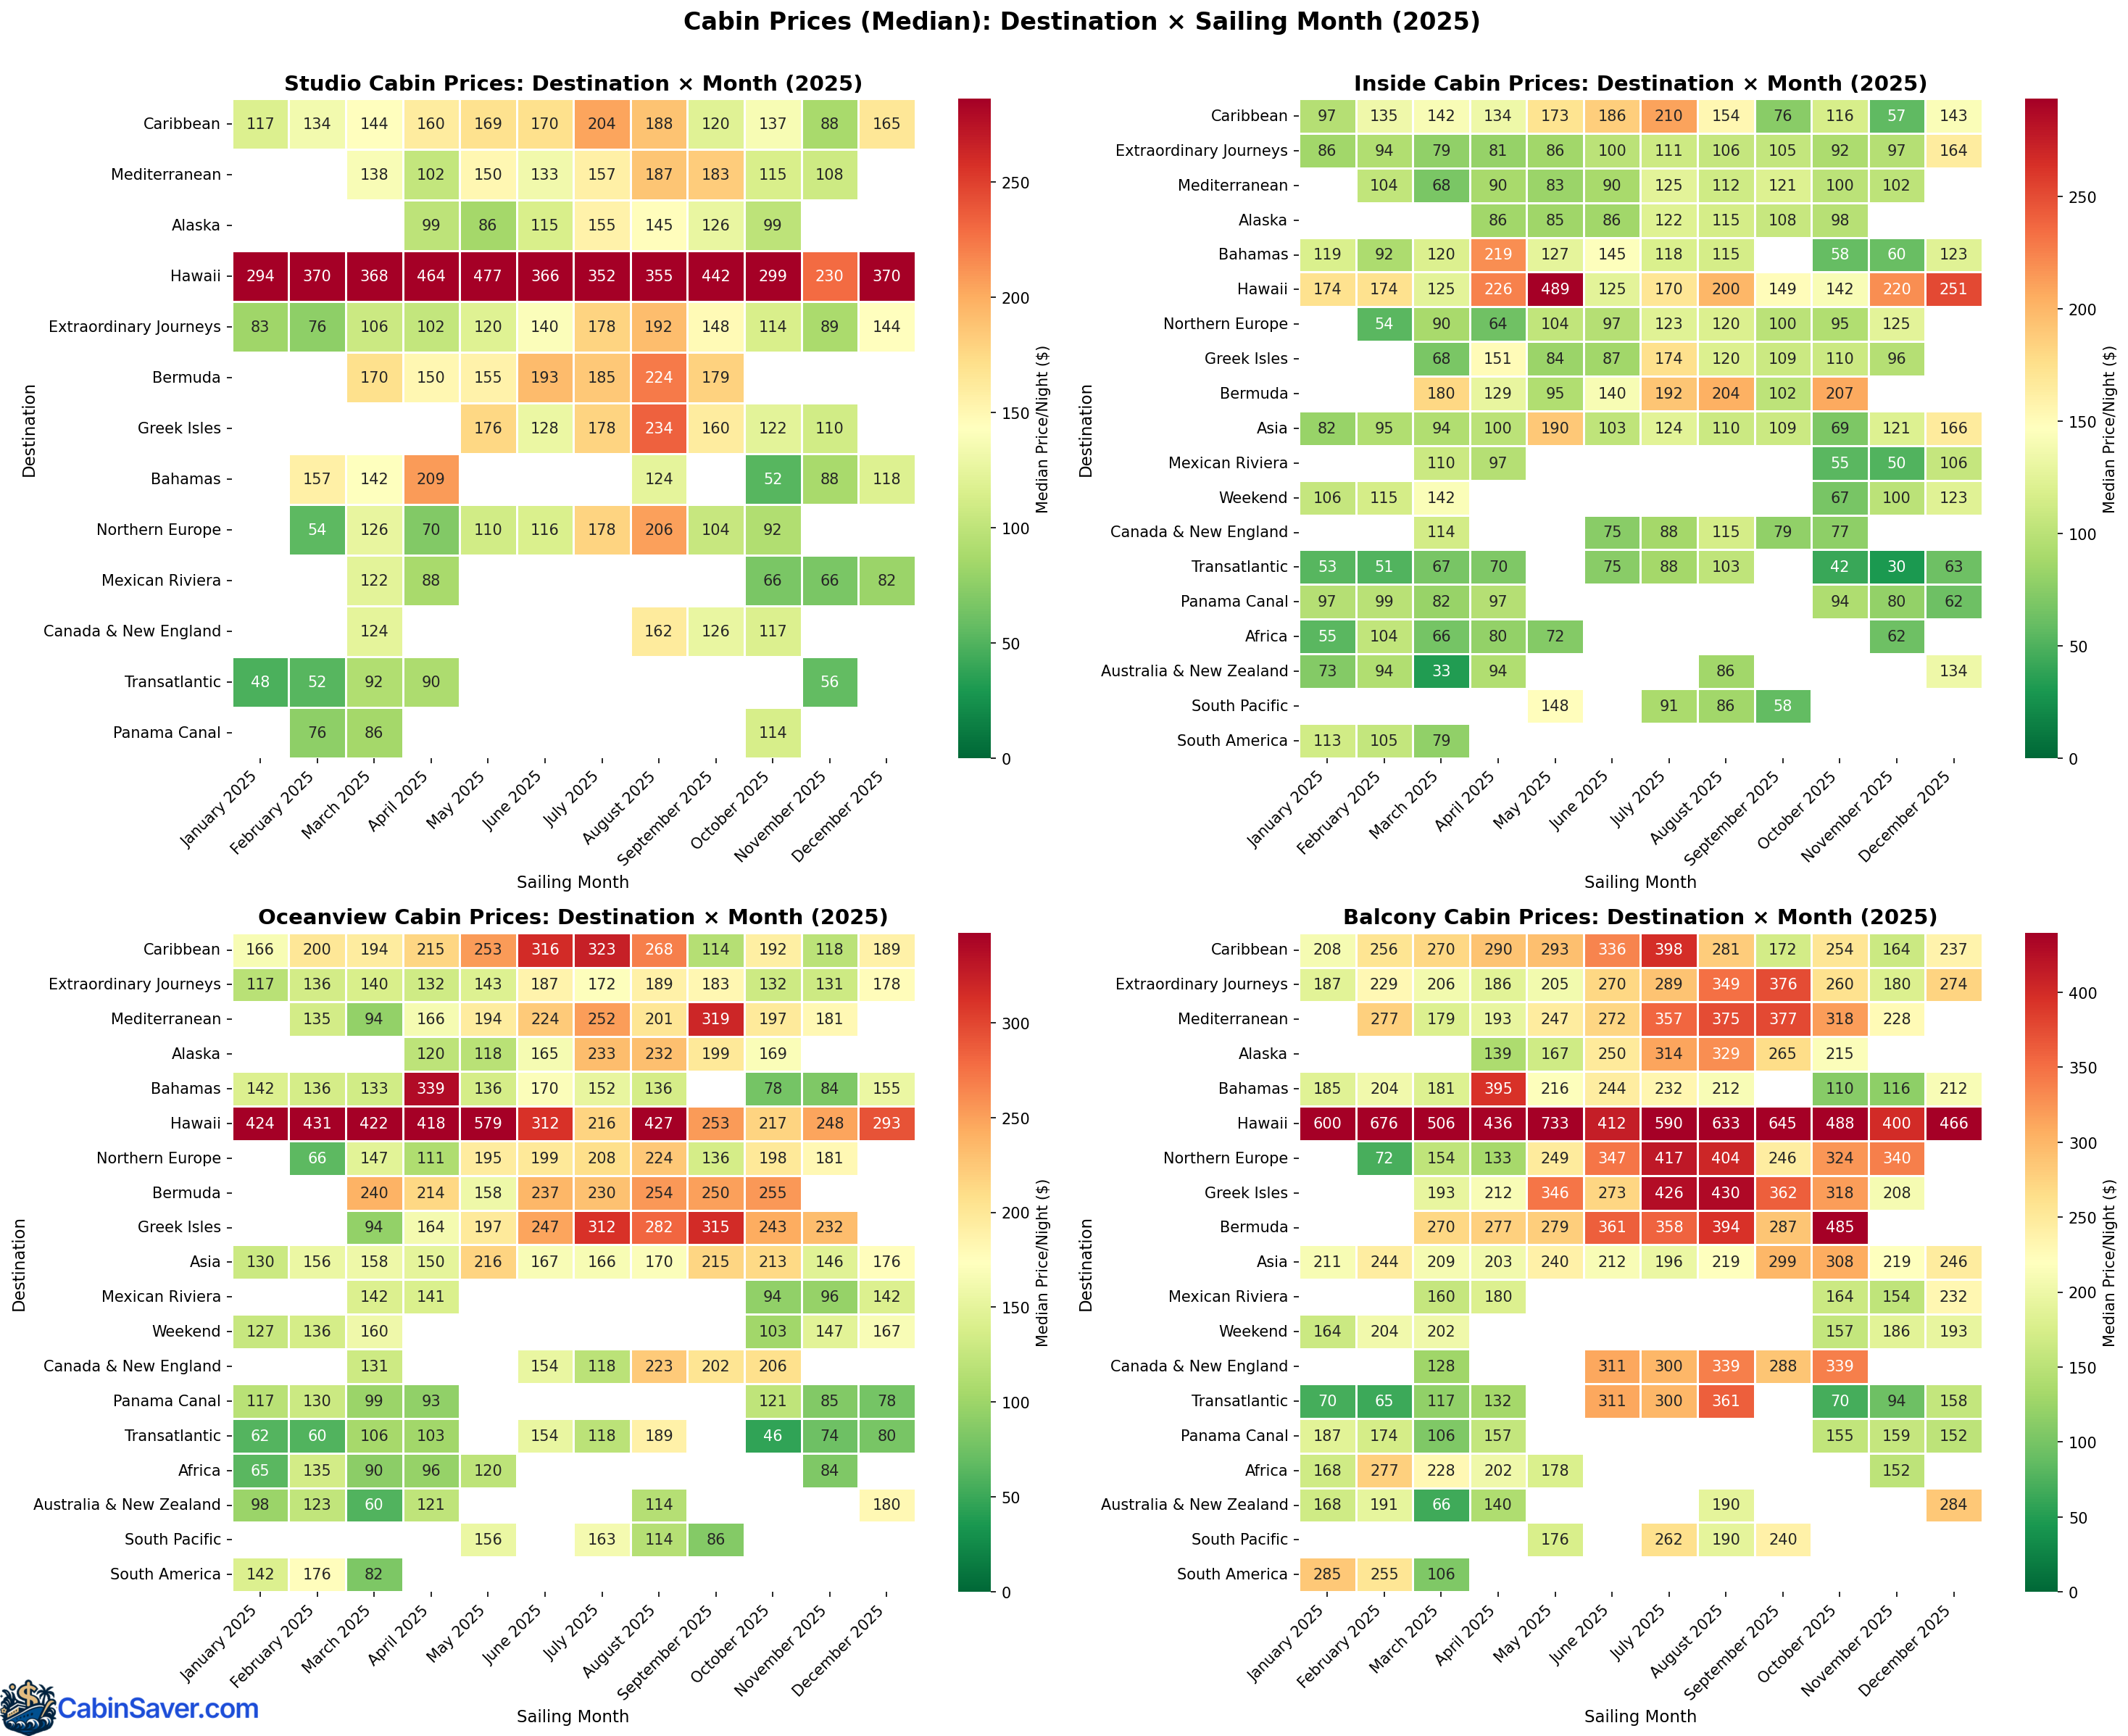
Summer months tended to have the highest prices due to high demand in peak vacation season. Hawaii was consistently expensive across all months.
Popular embarkation ports and destinations
The Sankey diagram below shows the relationship between where cruises departed from and where they sailed to. The thickness of each flow indicates which departure ports served which destinations most frequently.
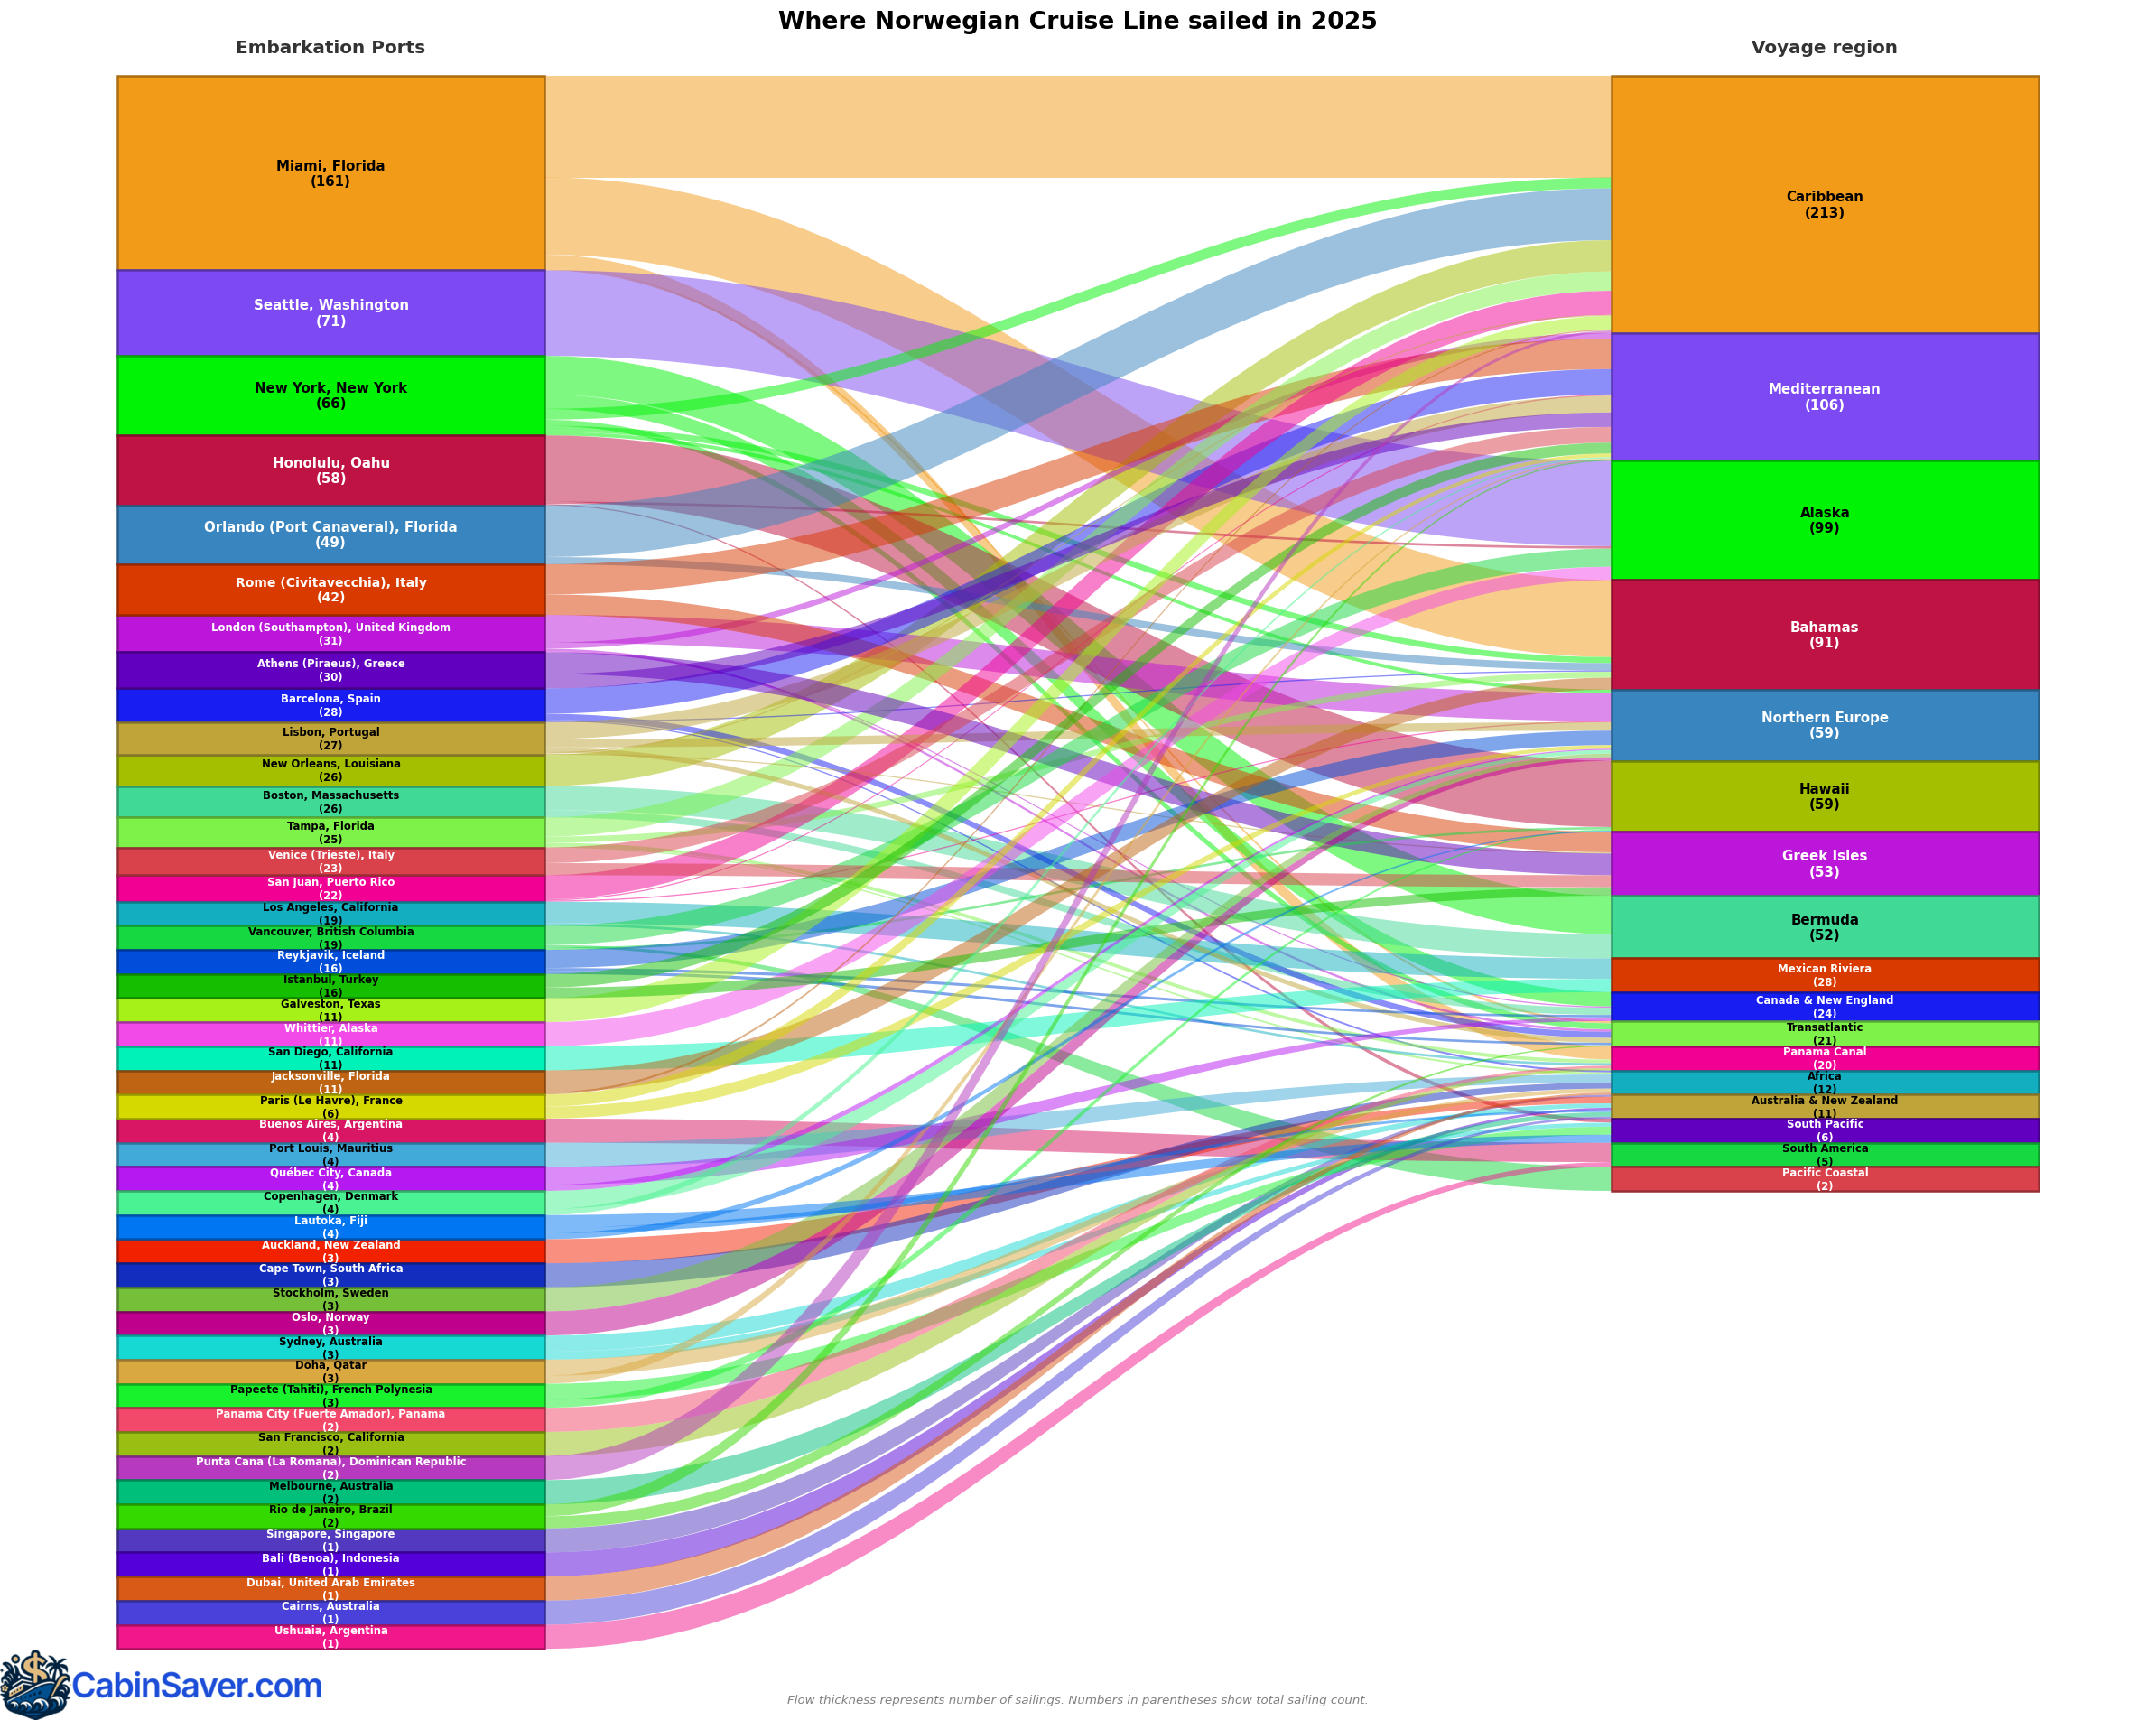
Miami, Seattle, and New York were the most popular departure ports. Miami sailed heavily to Caribbean and Bahamas, New York commonly sailed to Bermuda, and Seattle primarily sailed to Alaska.
Note: some sailings visit more than one destination, so that's why embarkation ports like Rio de Janeiro, Brazil have may have one sailing, but multiple outgoing lines.
💡 Tip: looking for your next cruise deal? Find it on cabinsaver.com/app/.
North America
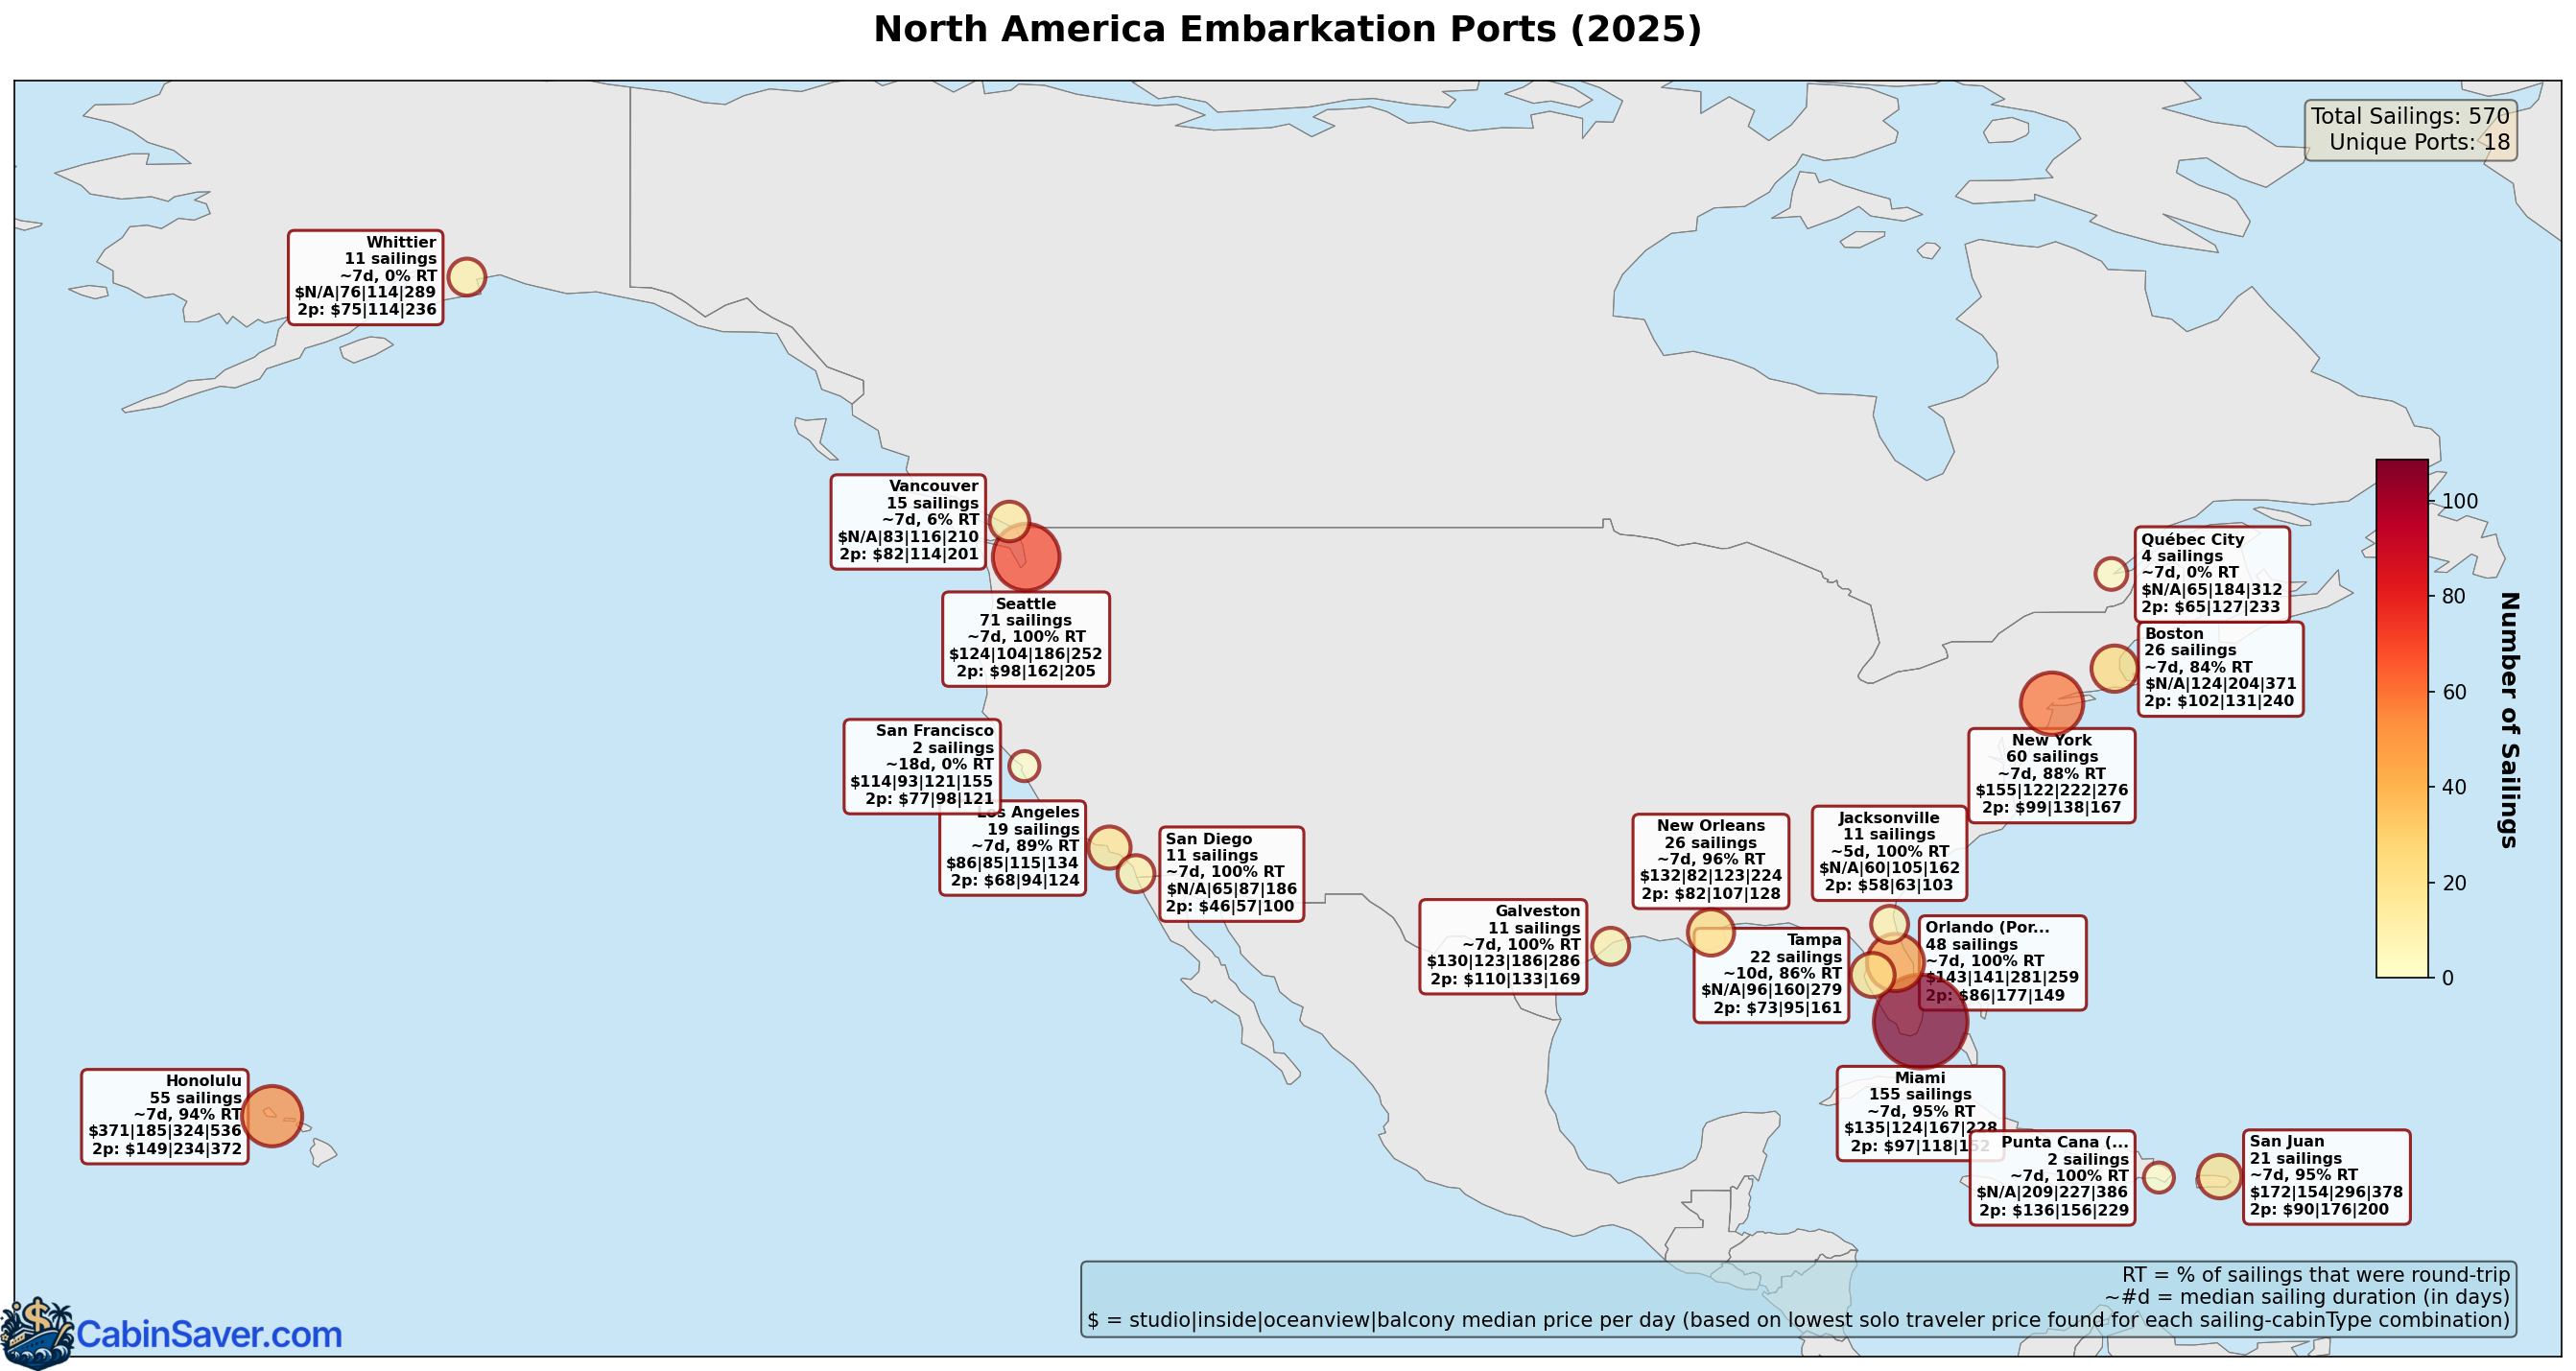
Miami, Florida led in popularity with 155 sailings, primarily serving Caribbean and Bahamas itineraries. Seattle, Washington followed with 71 sailings, almost exclusively Alaska cruises during summer season. New York ranked third with 60 sailings offering diverse destinations including Caribbean, Bermuda, and Transatlantic routes.
Europe-Mediterranean
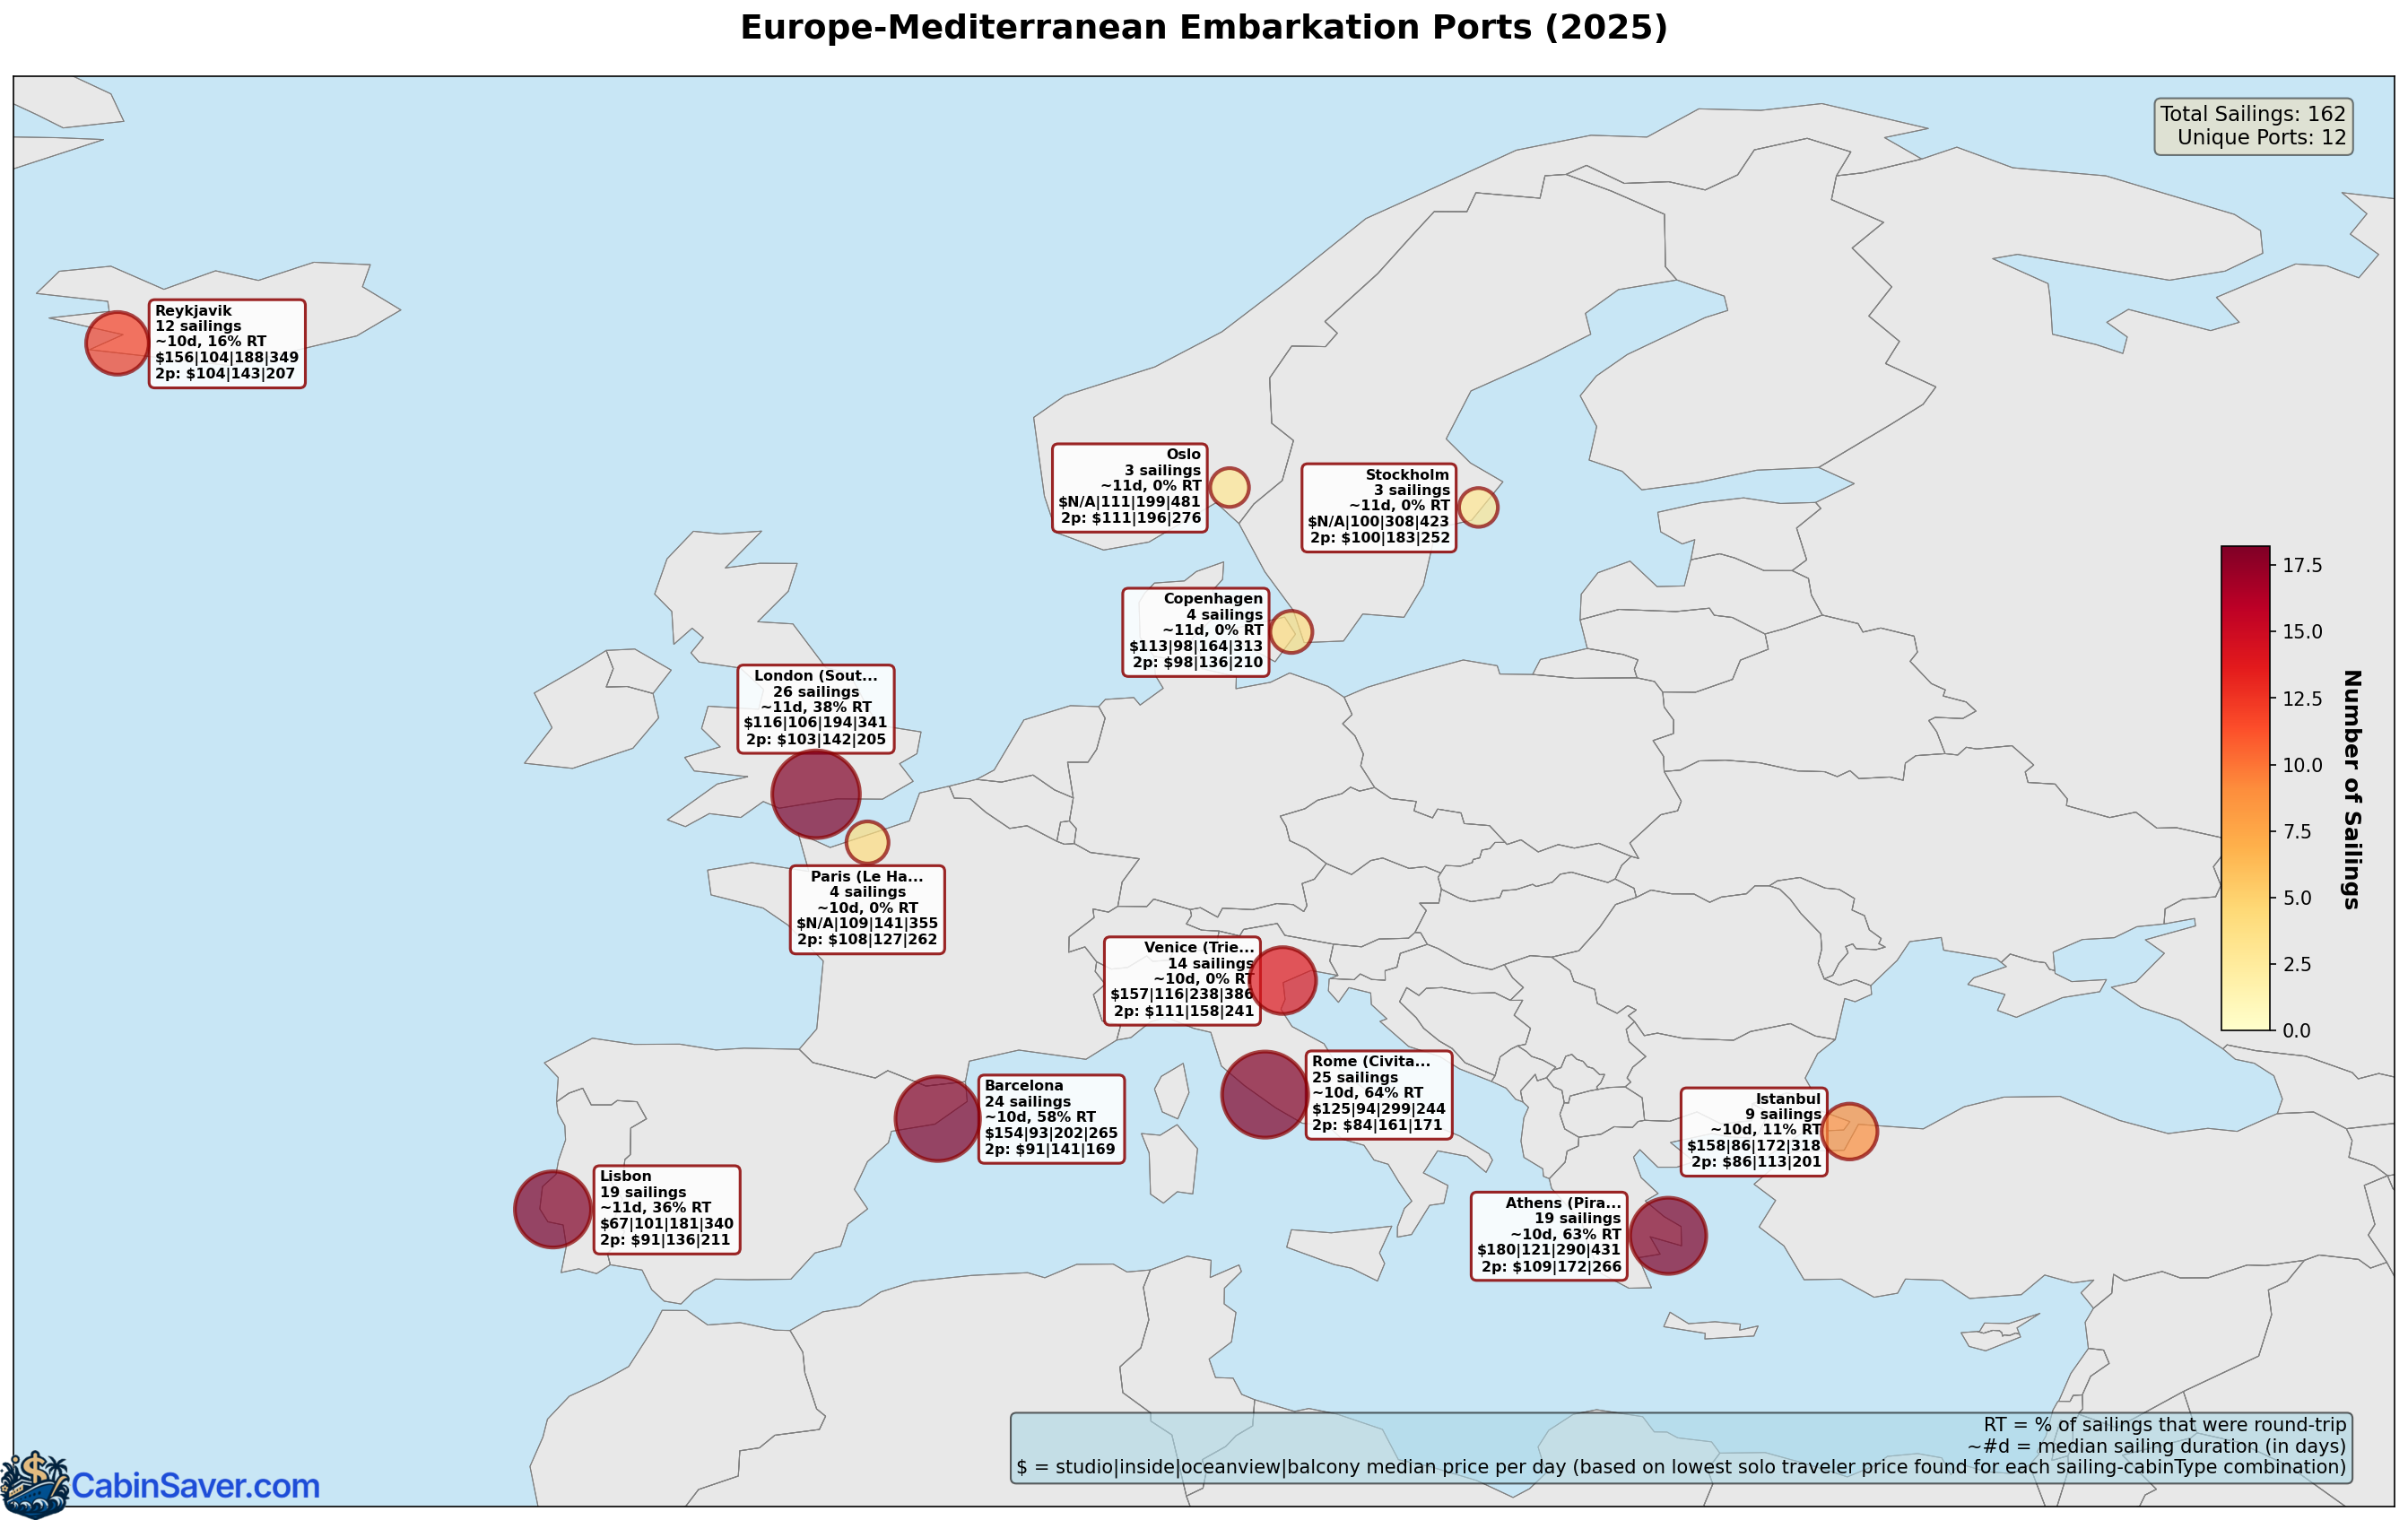
London (Southampton) led in popularity with 26 sailings, followed by Rome (25 sailings) and Barcelona (24 sailings). Most itineraries were 10-12 days in duration.
Asia-Pacific
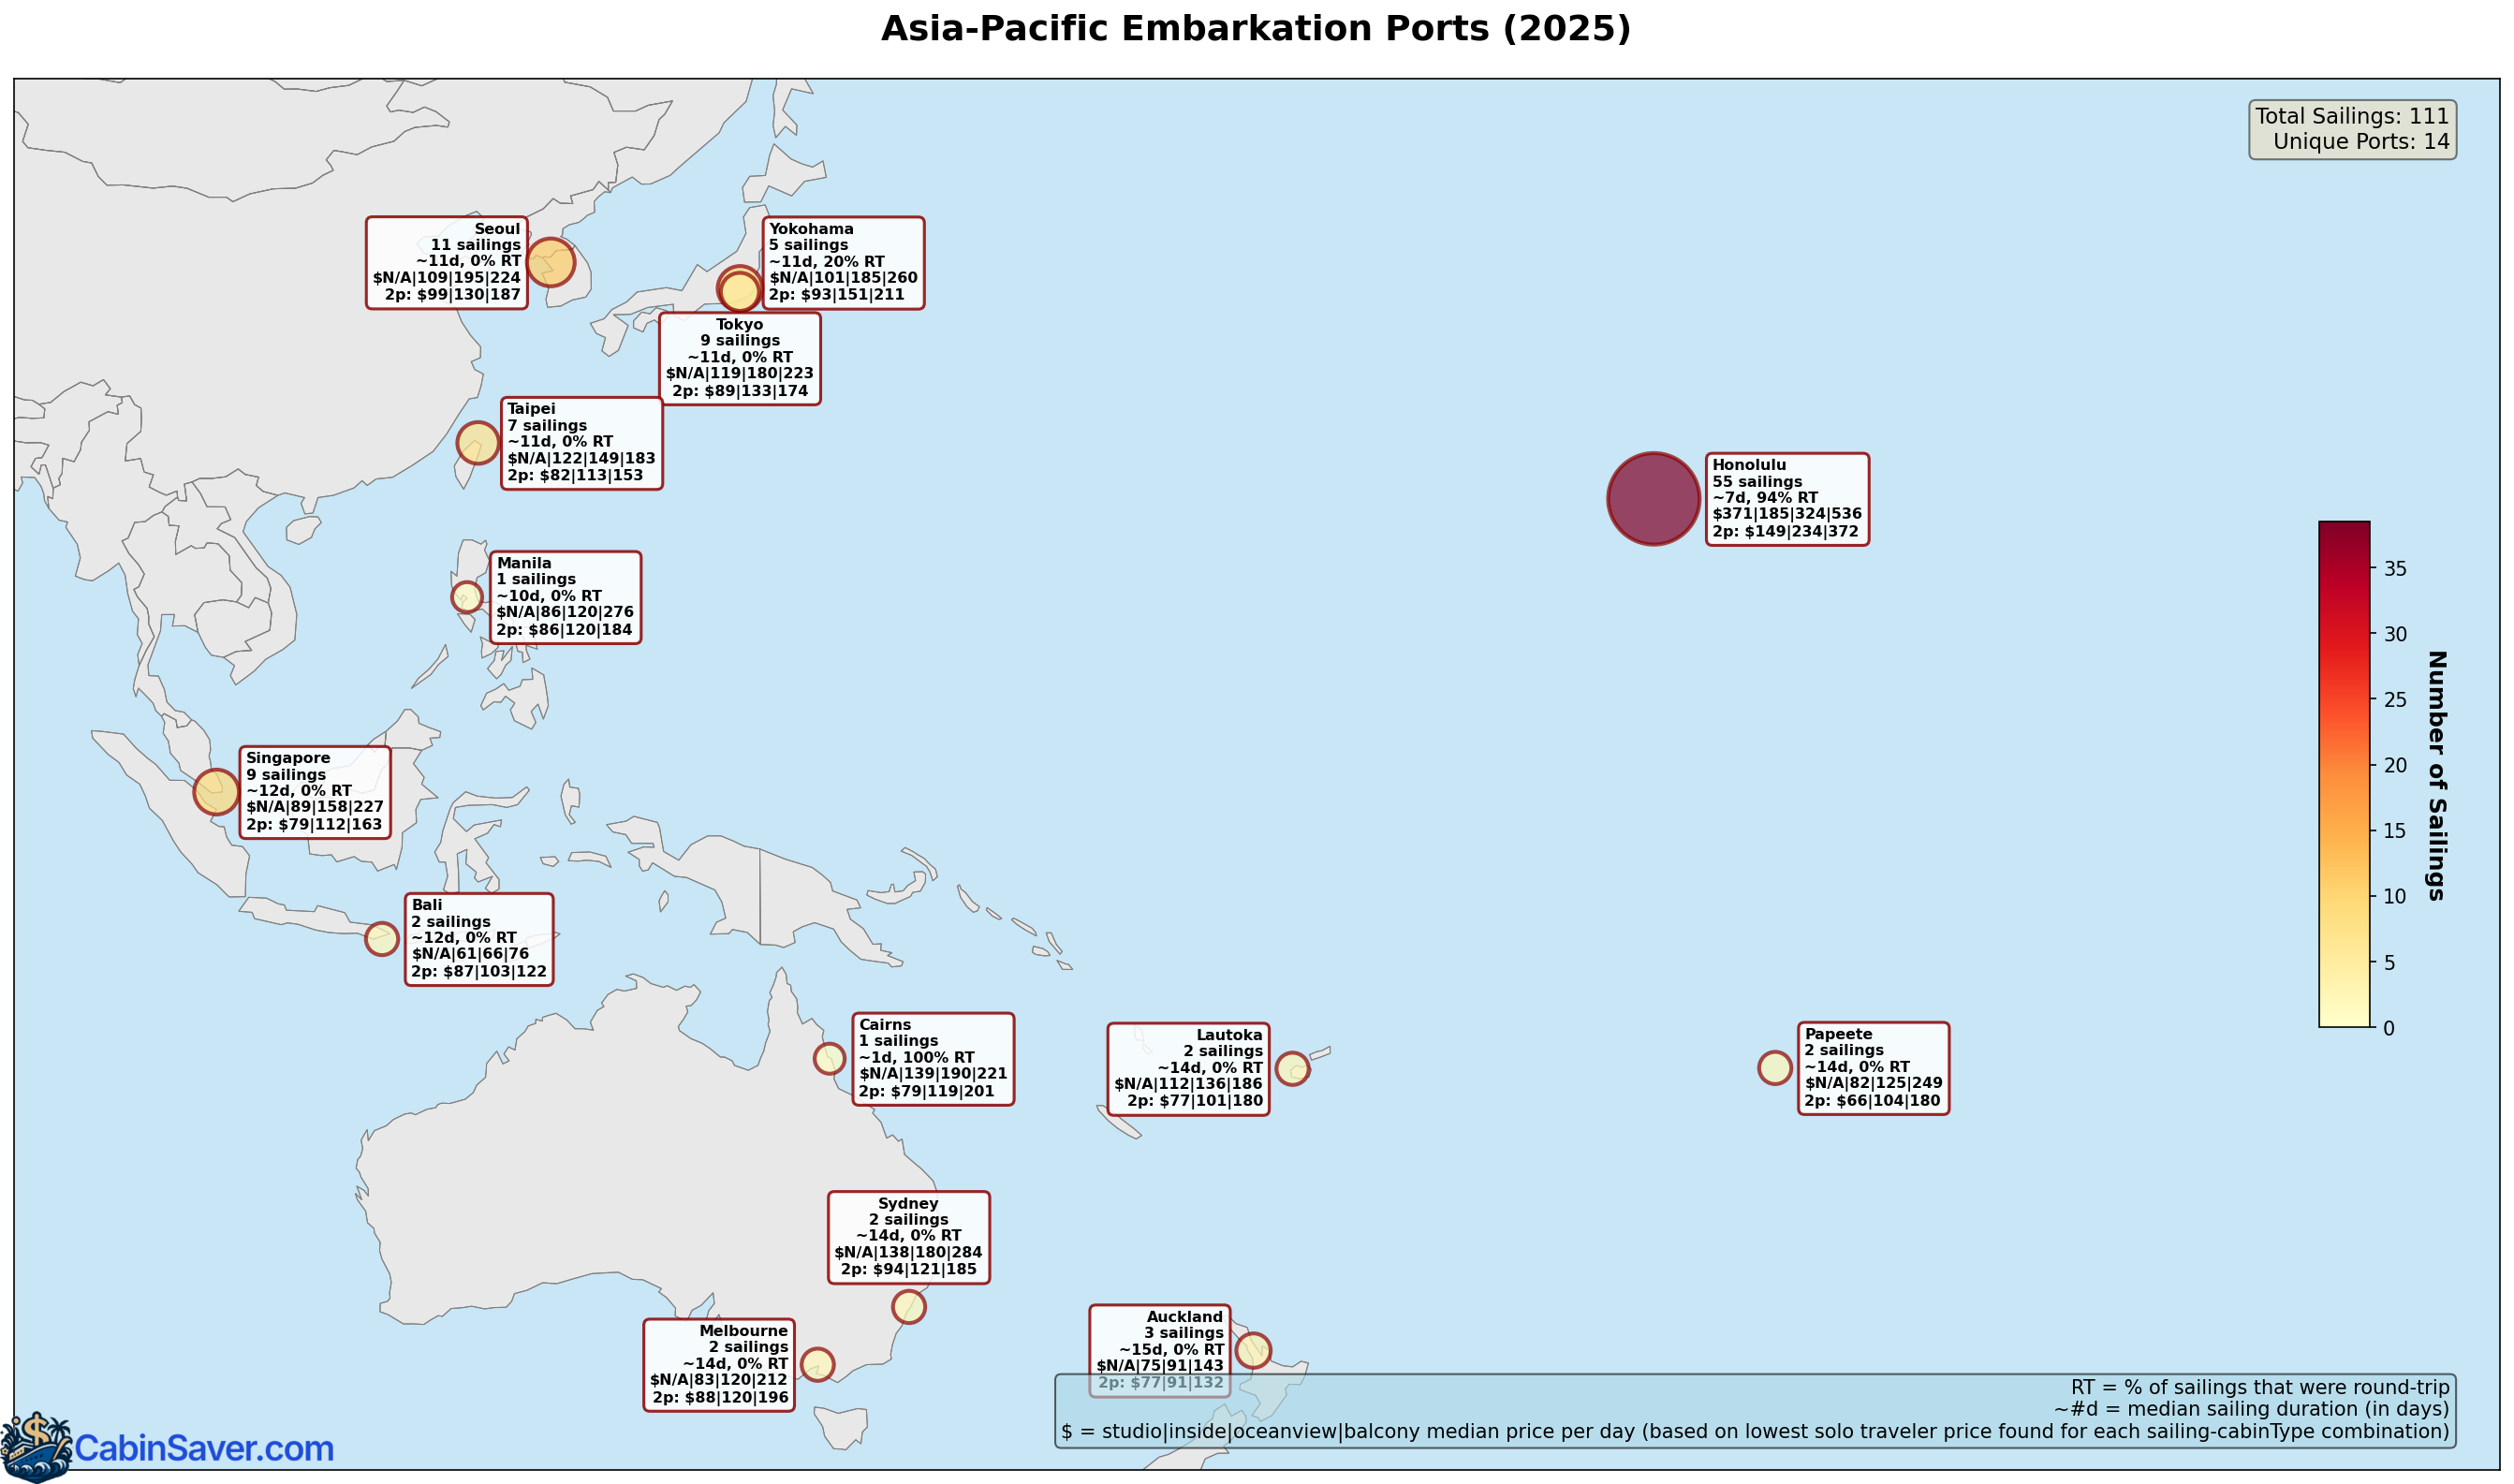
Honolulu led in popularity with 55 sailings, primarily serving Hawaiian itineraries. Popular Asian ports included Seoul, Tokyo, and Singapore. Asian itineraries typically lasted 11-12 days.
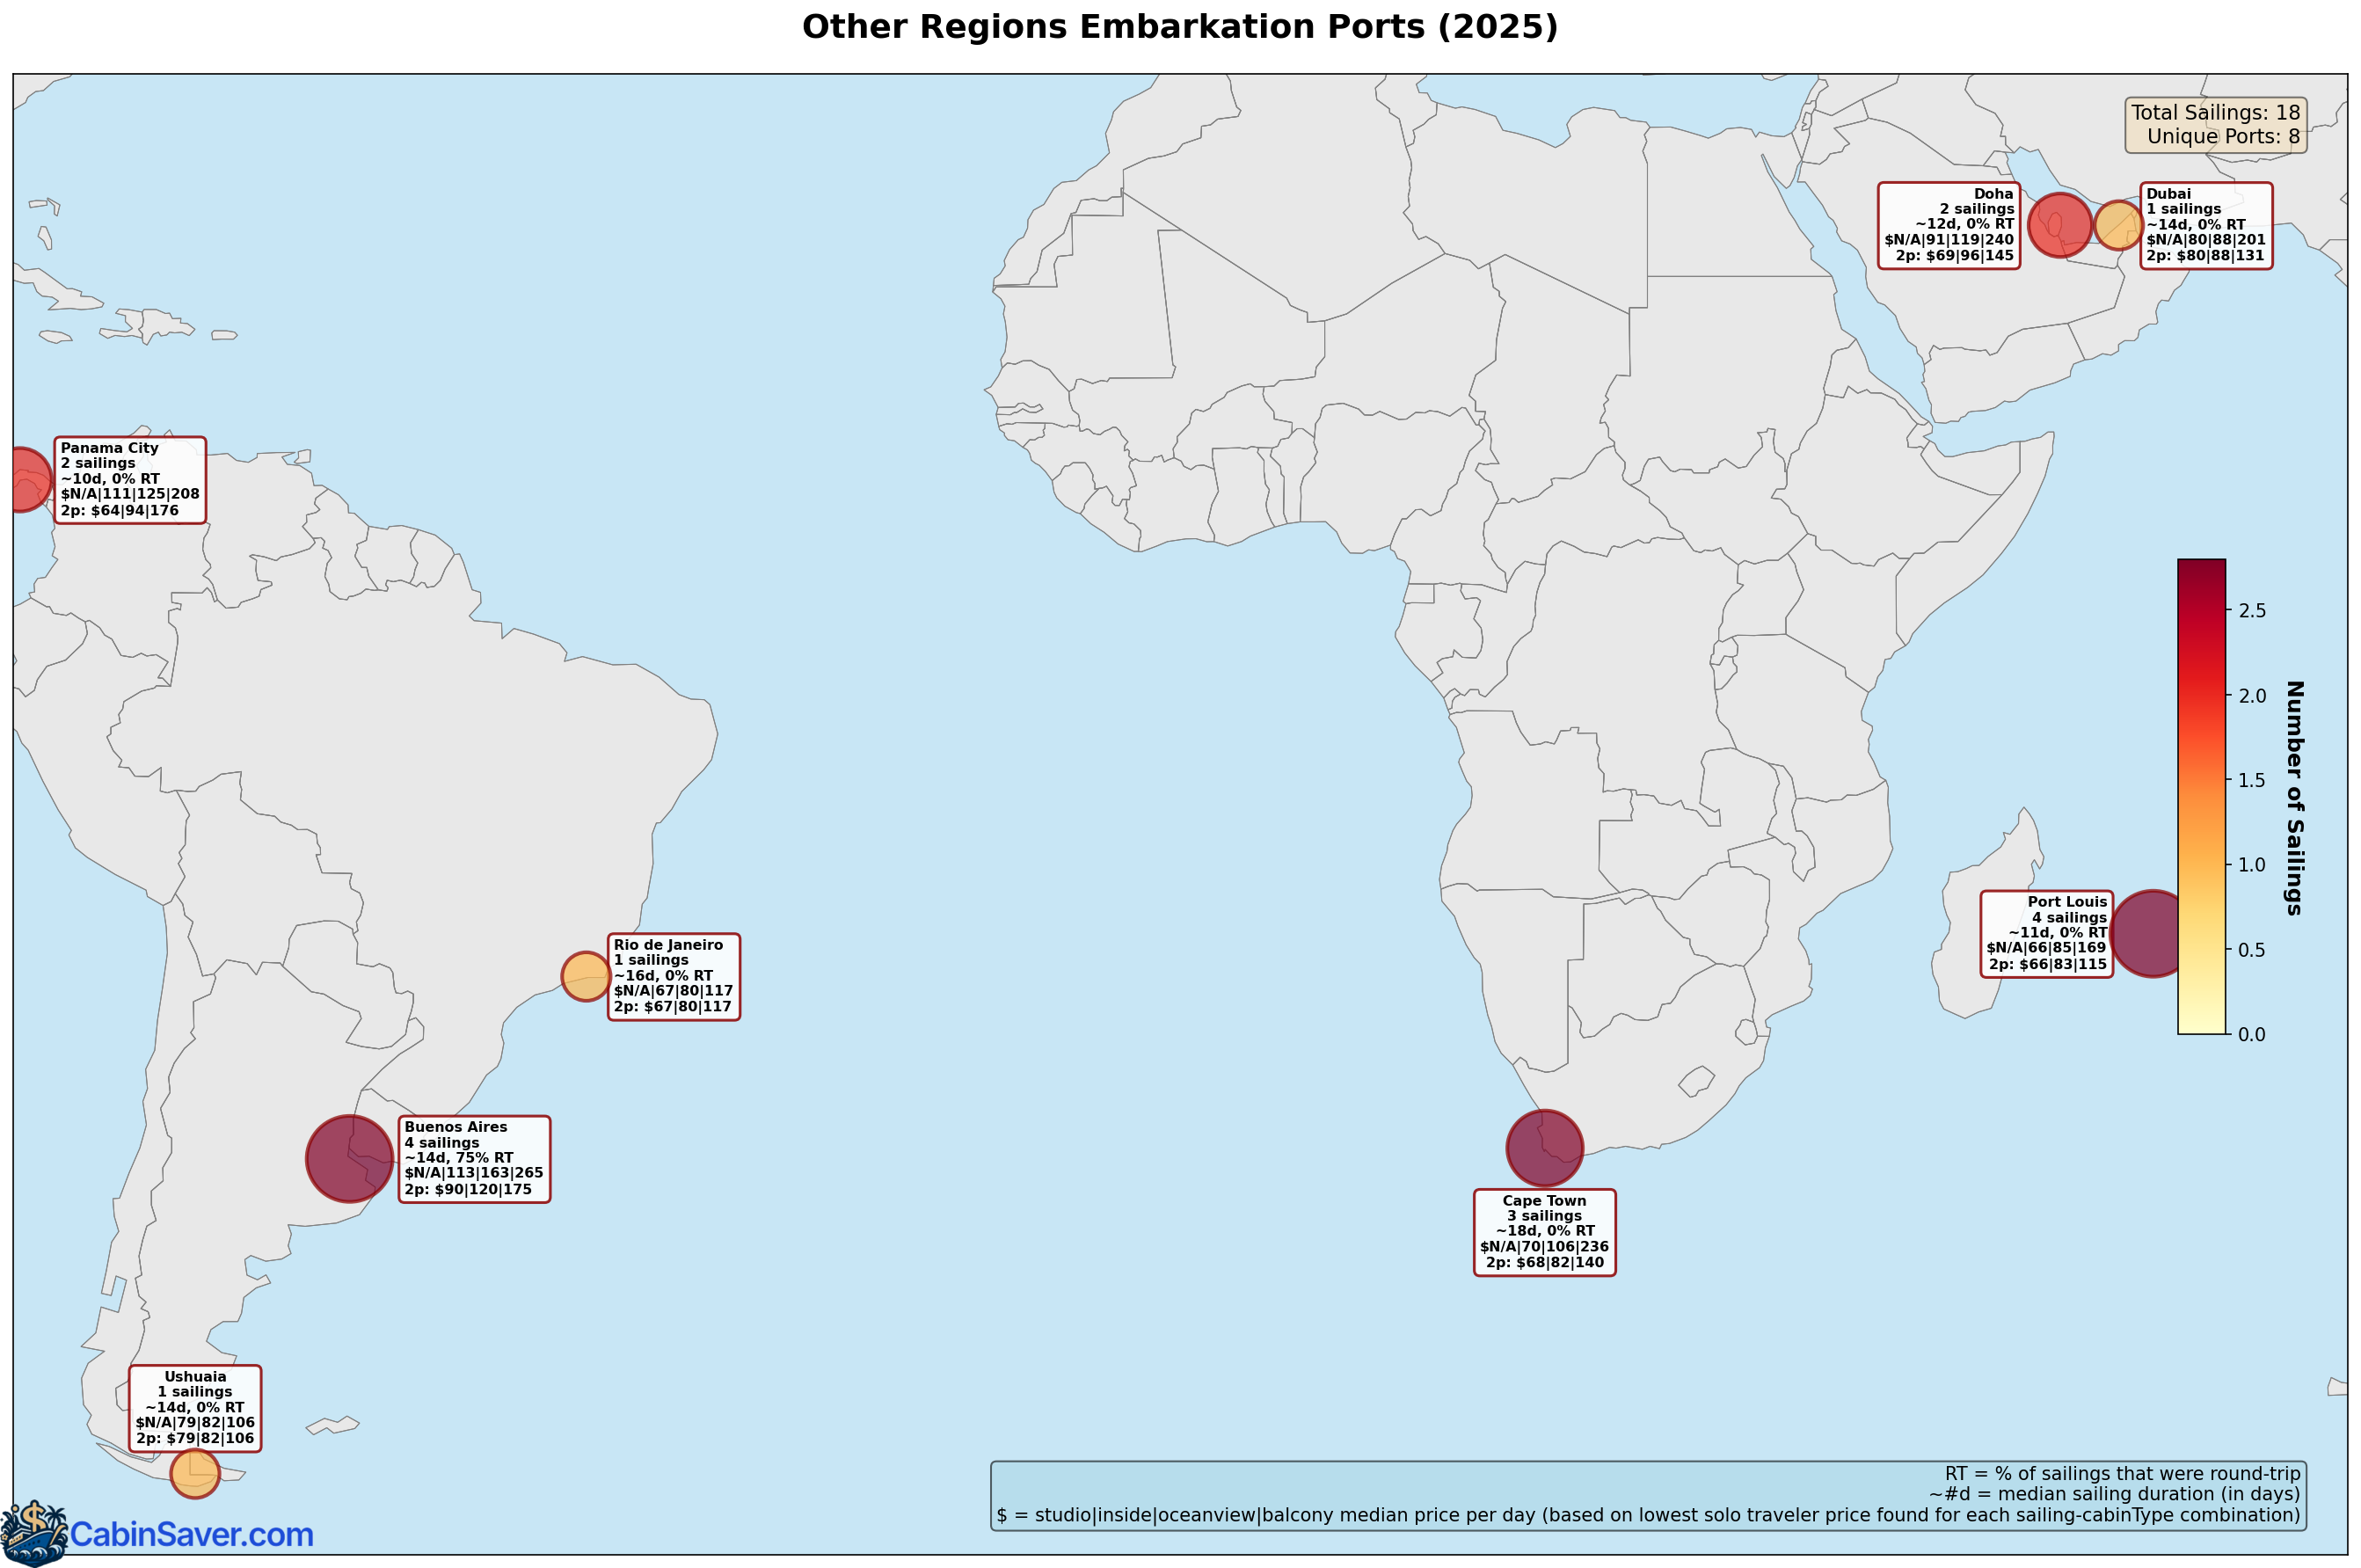
Other regions embarkation ports
Less popular embarkation ports were in South America, Africa, and Middle East.
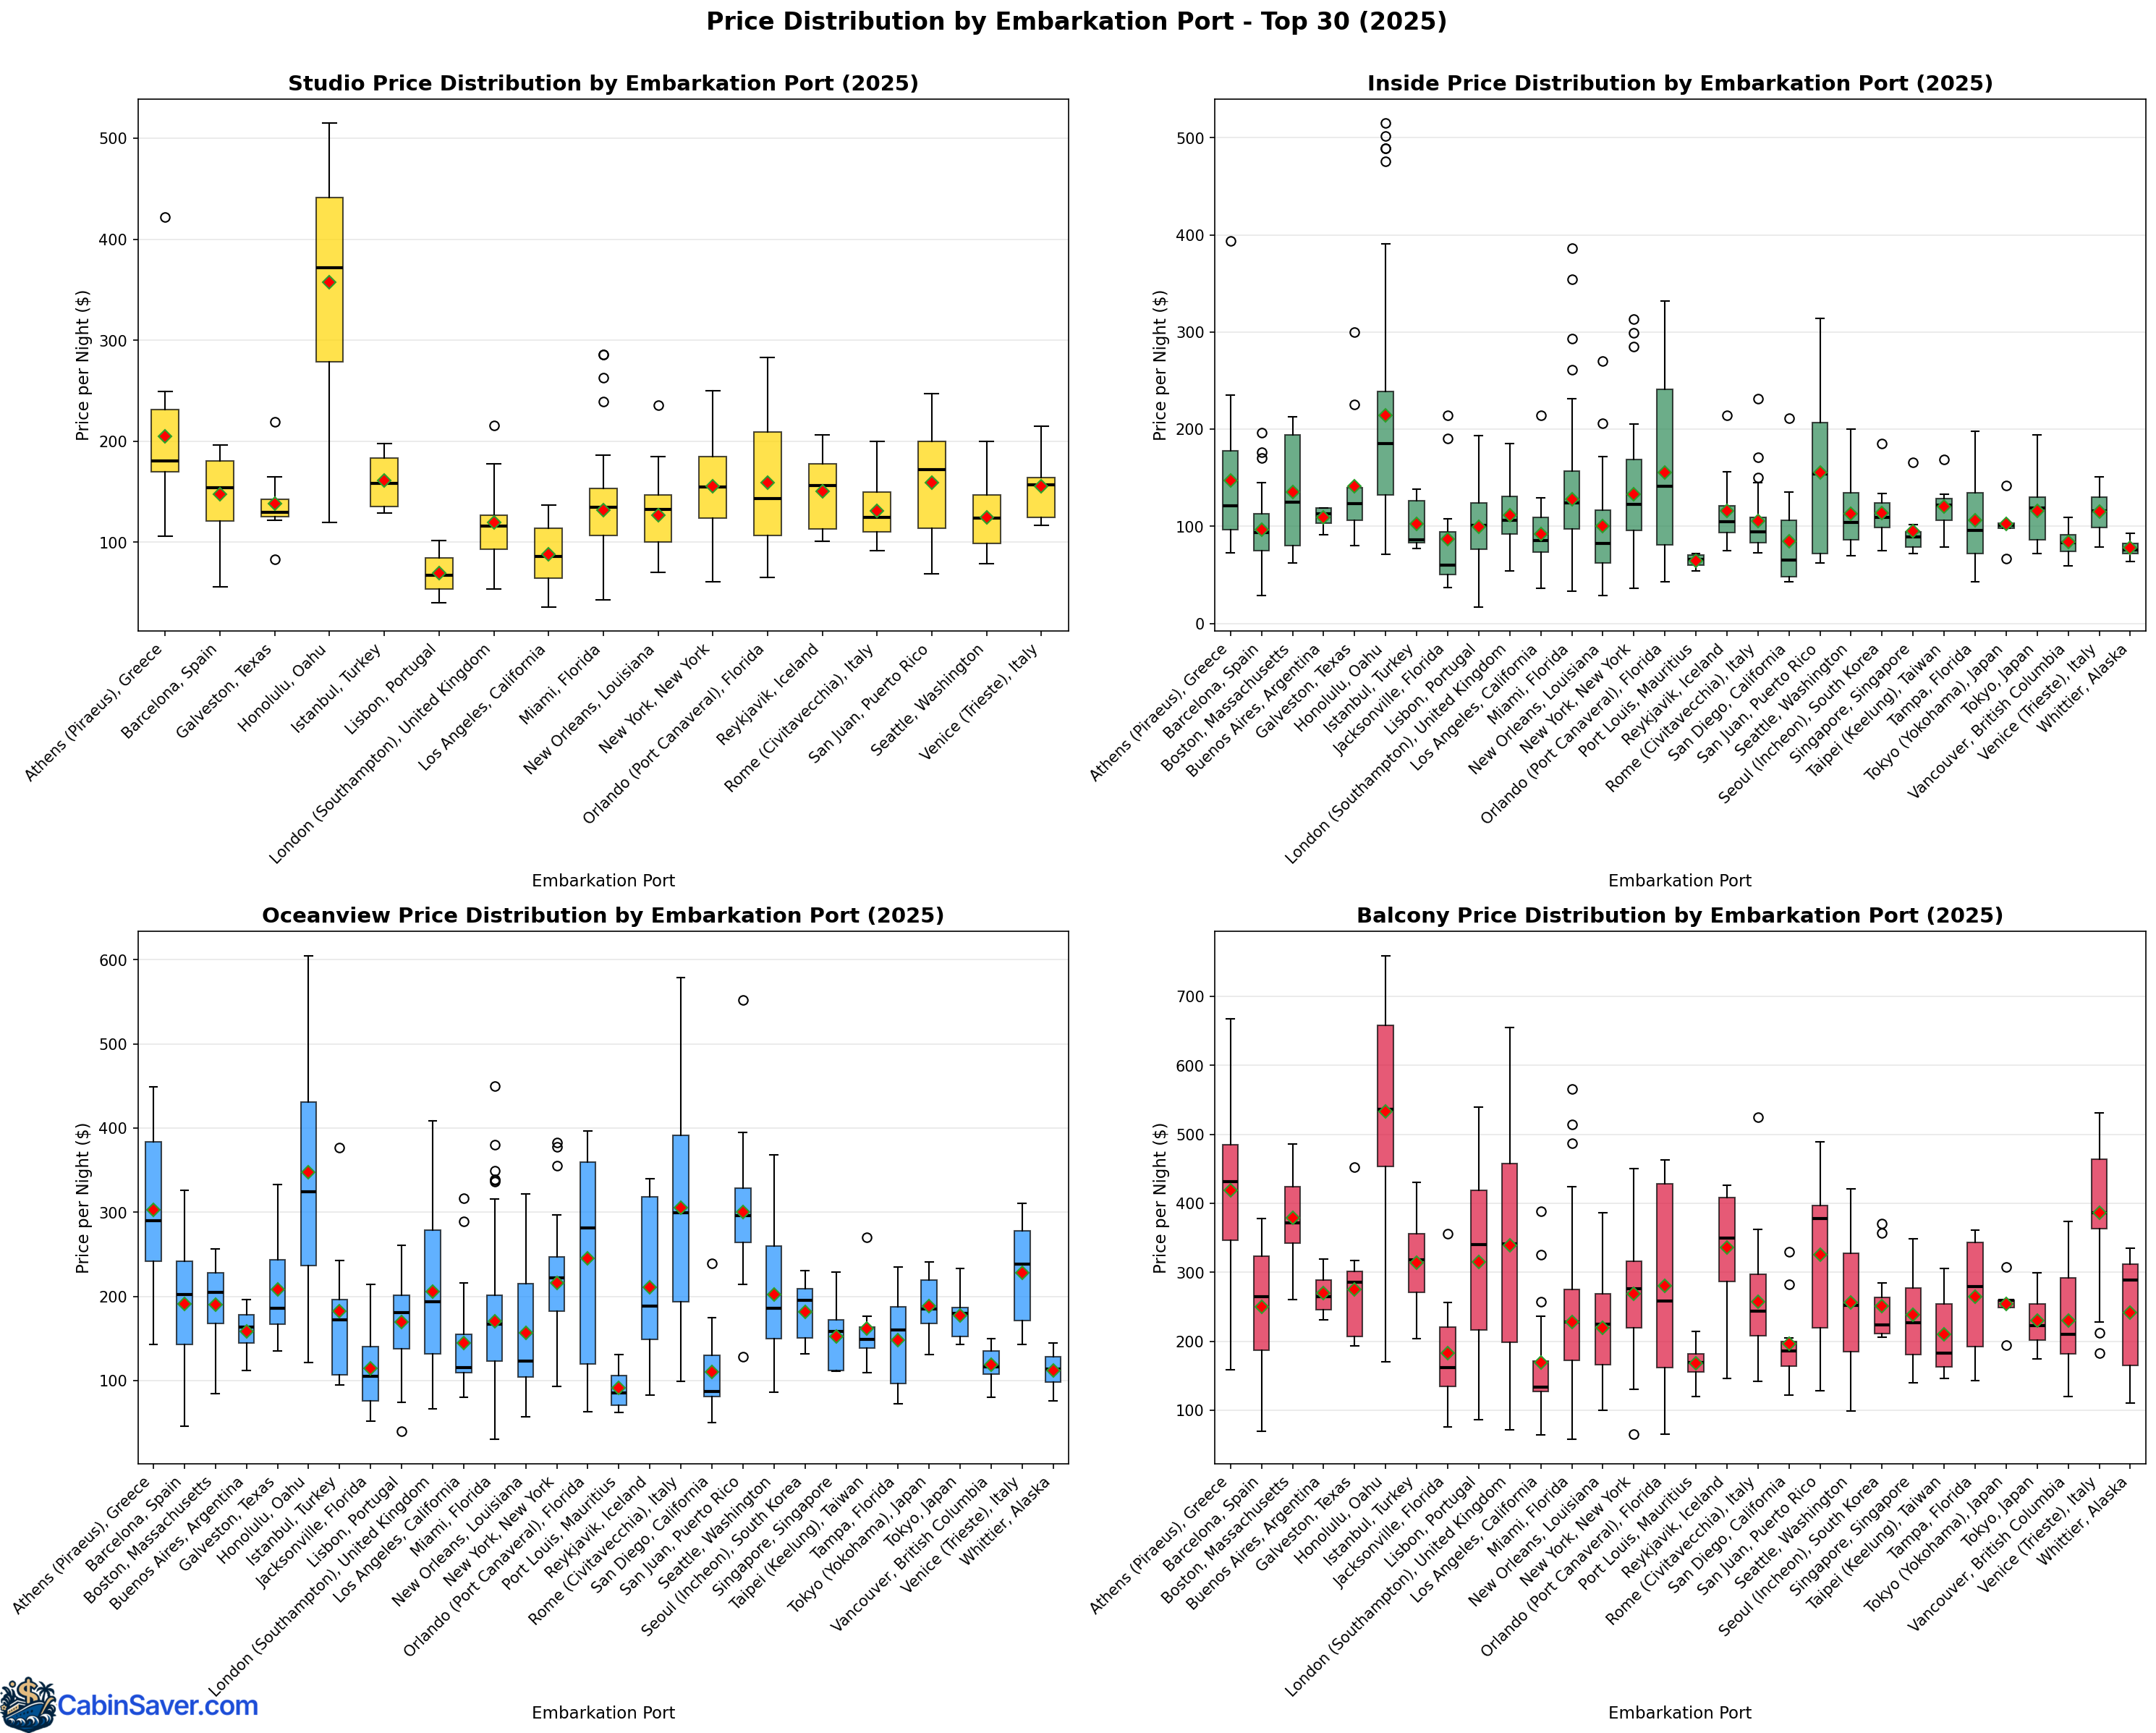
Detailed pricing by embarkation port
Embarkation port pricing by month
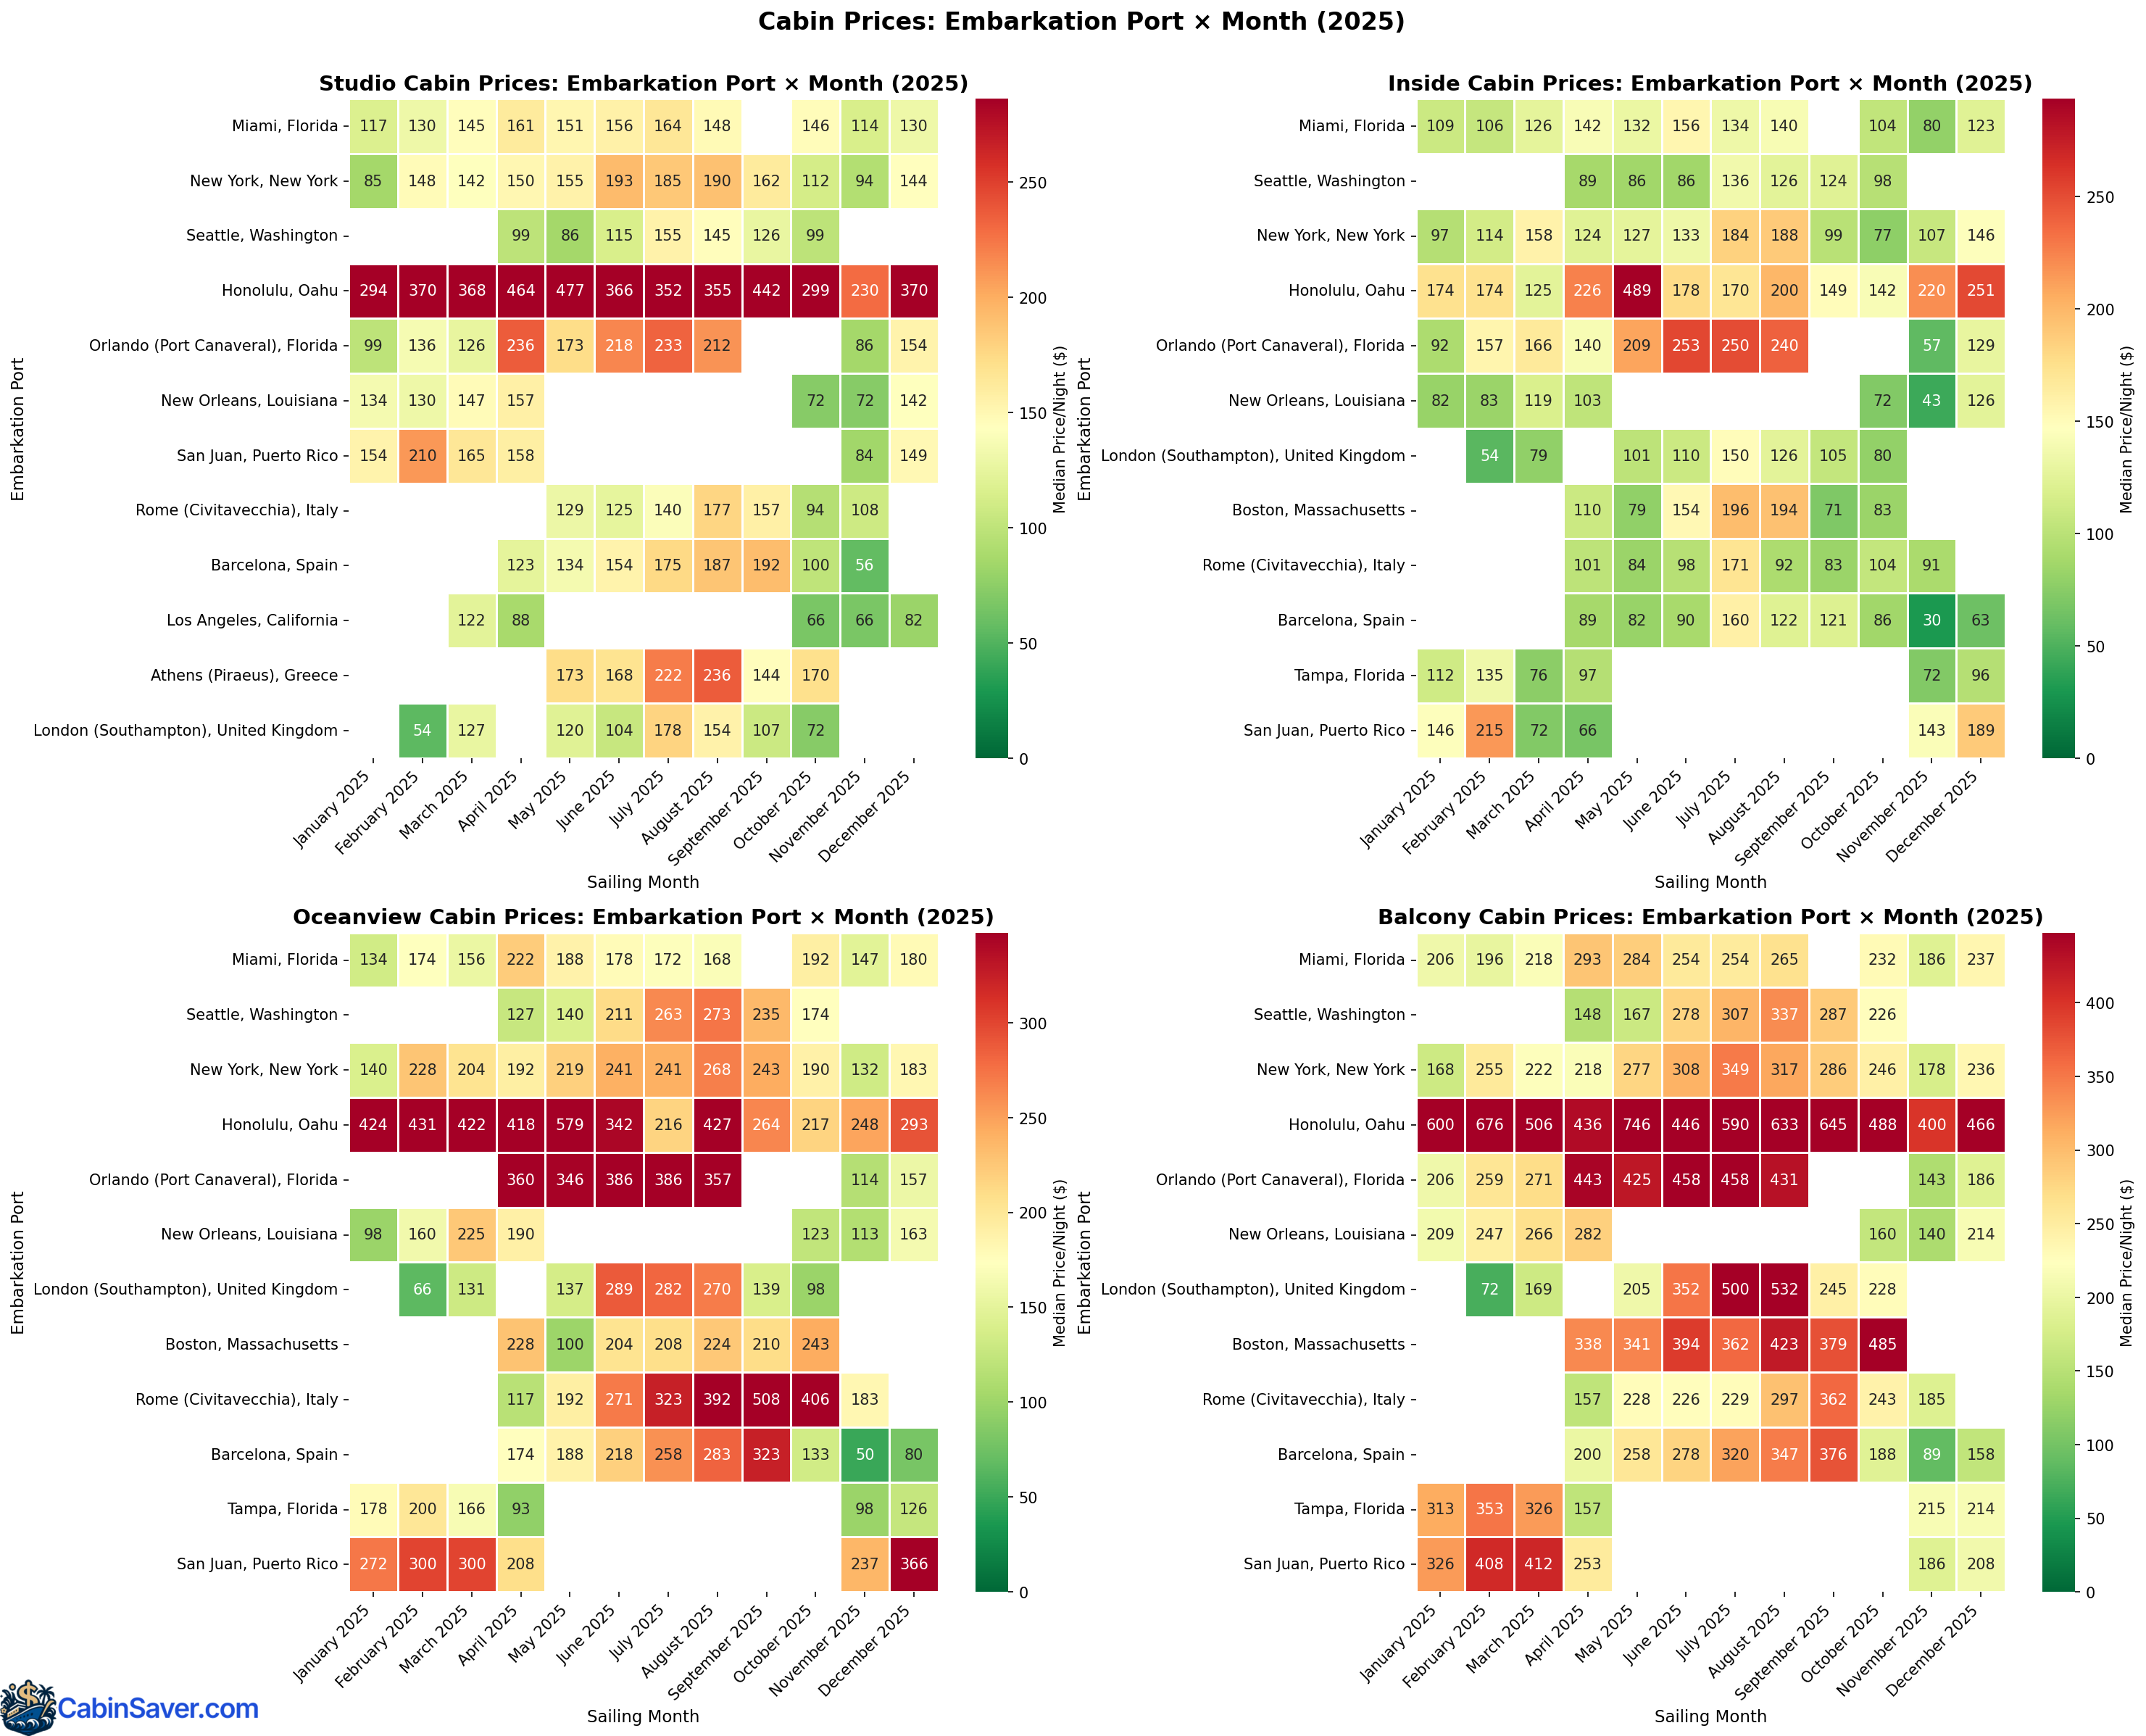
Honolulu prices were high as expected. Interestingly, Orlando (Port Canaveral) prices spiked higher than most embarkation ports during the summer.
Popular ports of call
Some ports were visited more frequently than others. Most ports were public, while others such as Great Stirrup Cay and Harvest Caye were privately owned by the cruise line.

Great Stirrup Cay (NCL's private island in the Bahamas) led with 197 sailings, followed by Puerto Plata with 105 sailings and Cozumel with 103 sailings. Caribbean and Alaskan ports made up most of the most-visited list.
Popular ports of call by month
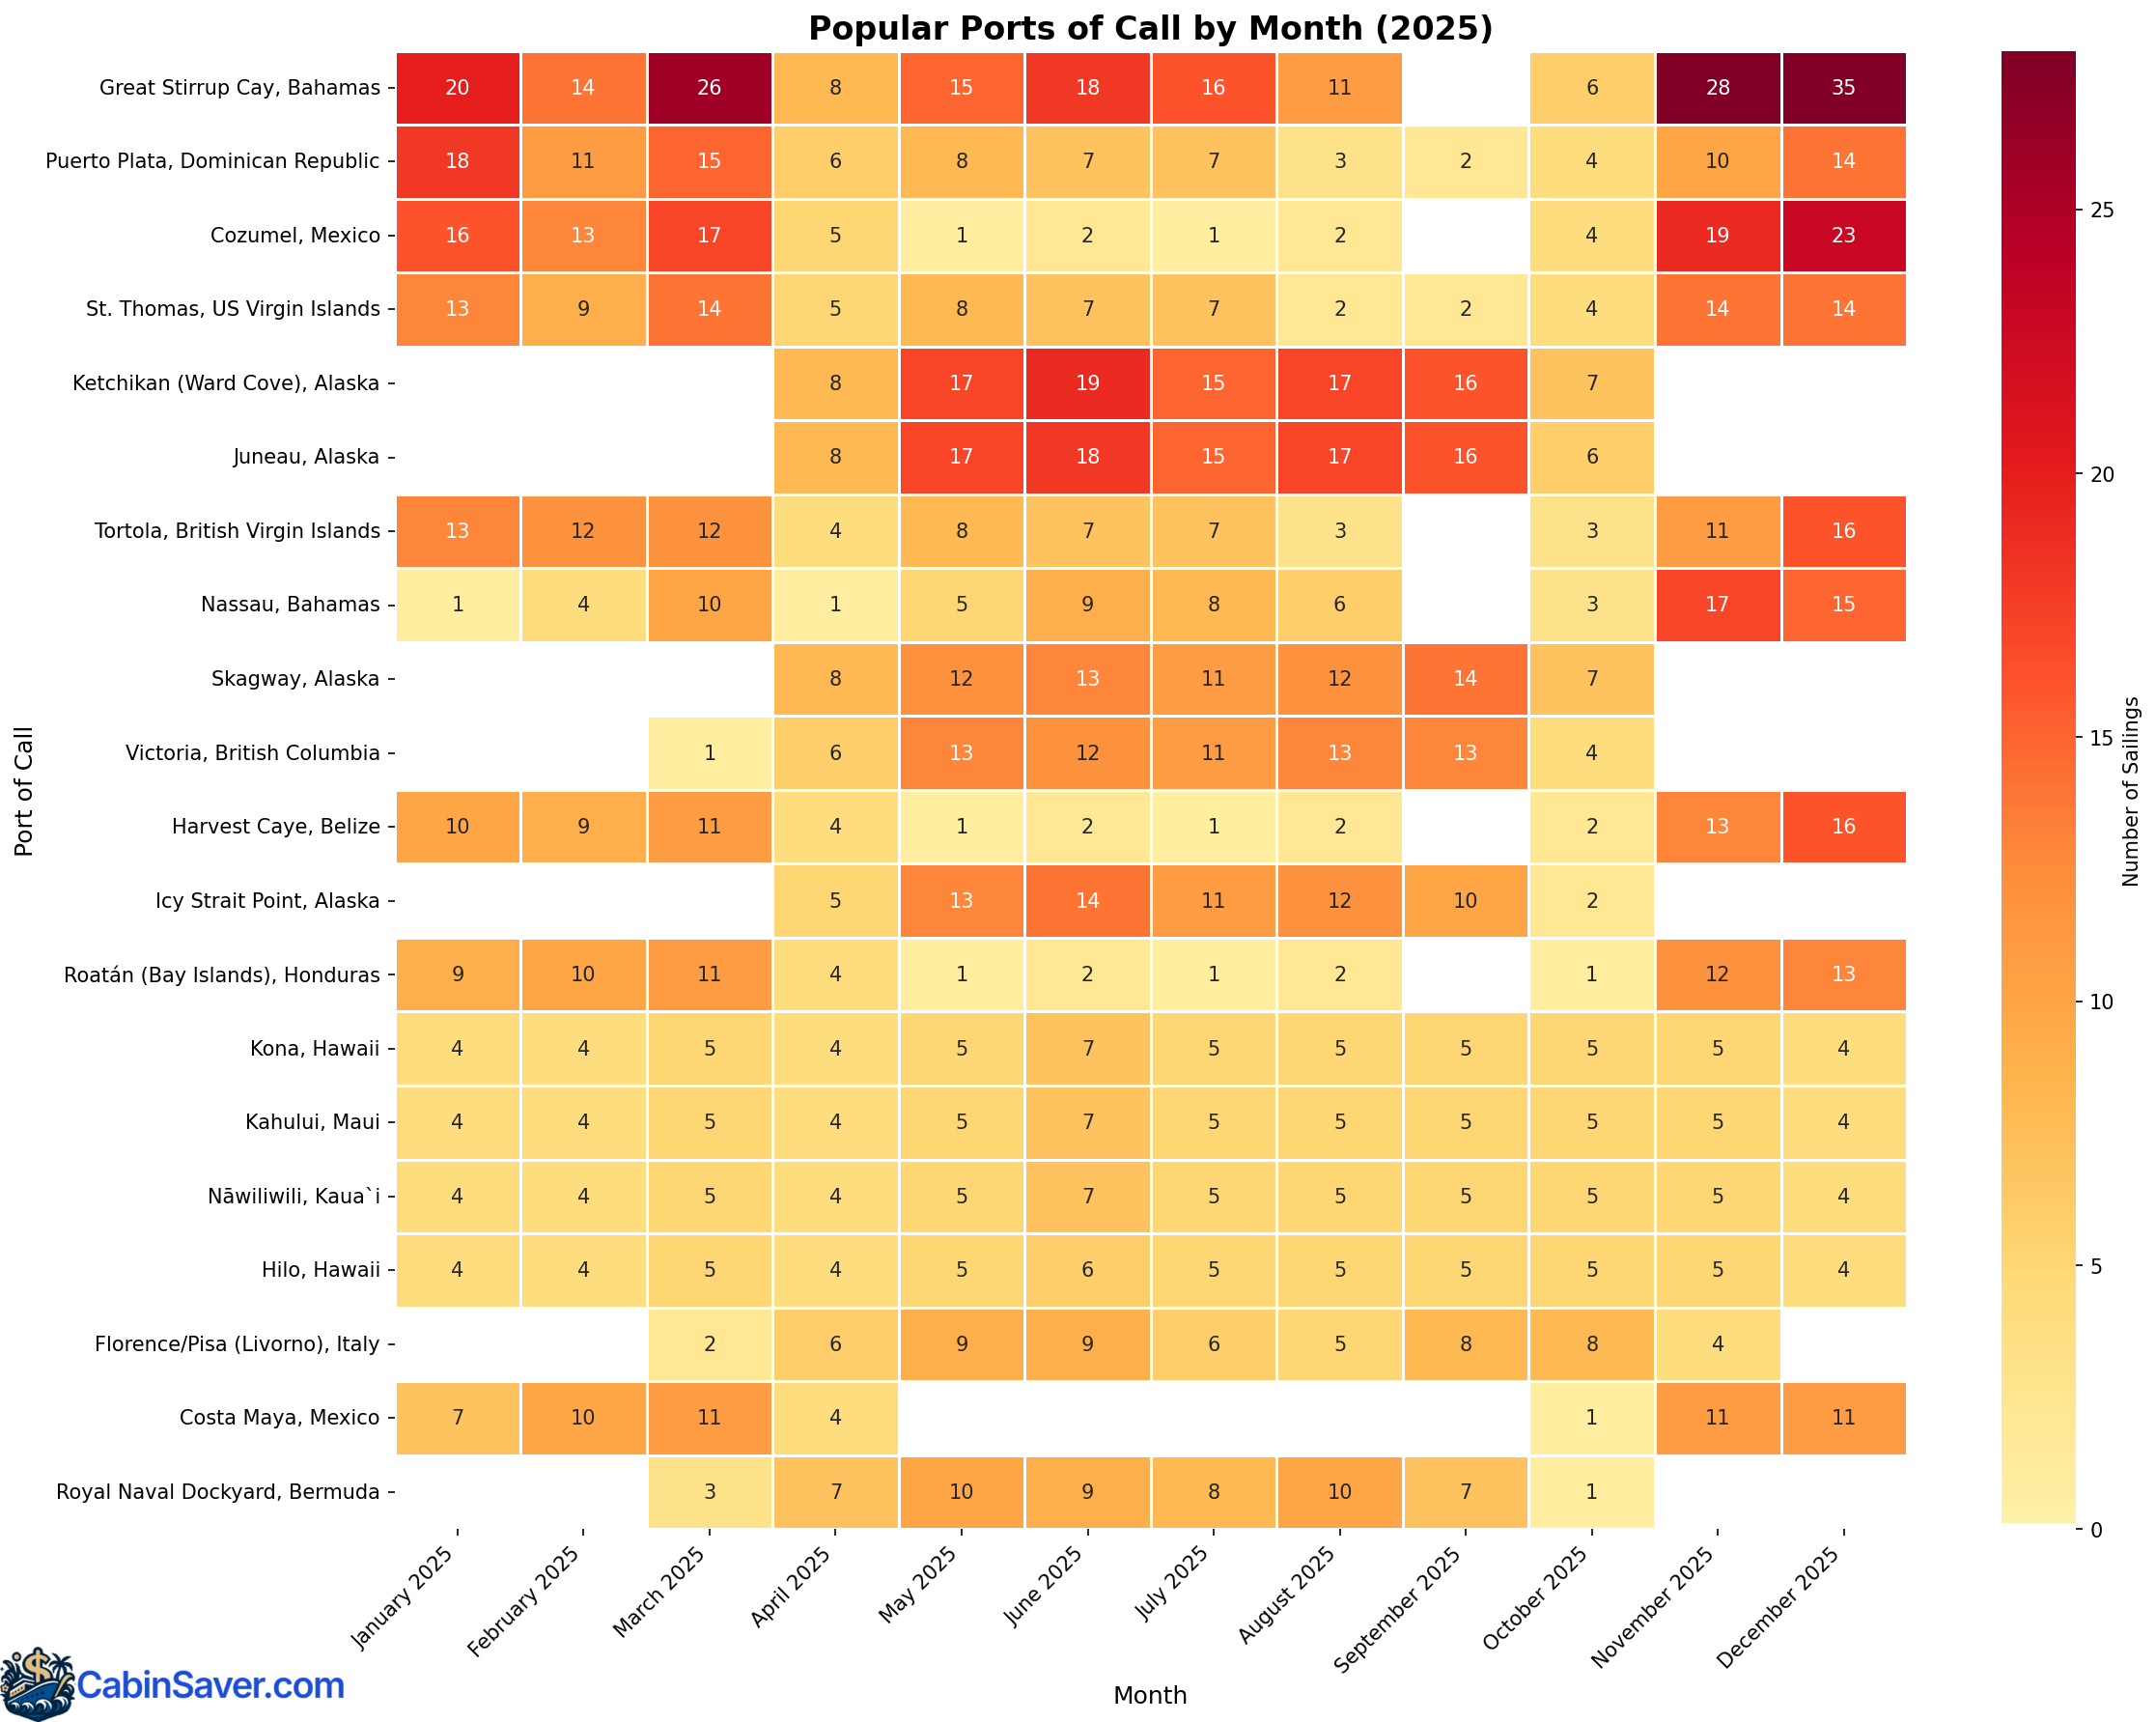
Caribbean ports were most active in winter and early spring, while Alaskan ports (Ketchikan, Juneau, Skagway) peaked during summer months (May-September). Hawaiian ports sailed consistently throughout the year, with a peak in June due to the NCL Sun ship taking one-way trips between Honolulu and Vancouver. Bermuda didn't have any stops during colder months.
Pricing
This section of the article analyzes additional pricing patterns across different months, booking windows, popular embarkation ports, and destinations. All prices shown are median values per night (in USD) and are broken down by cabin type (studio, inside, oceanview, and balcony). Note that sailing prices commonly fluctuate.
Pricing trends by month
Seasonal demand significantly impacted cruise pricing. Summer months (June-August) typically saw higher prices due to vacation season's high demand, while Fall months offered better value for budget-conscious travelers.

August saw peak pricing ($370+ for balcony cabins), while November offered the lowest prices ($70-175 per night).
Pricing by ship
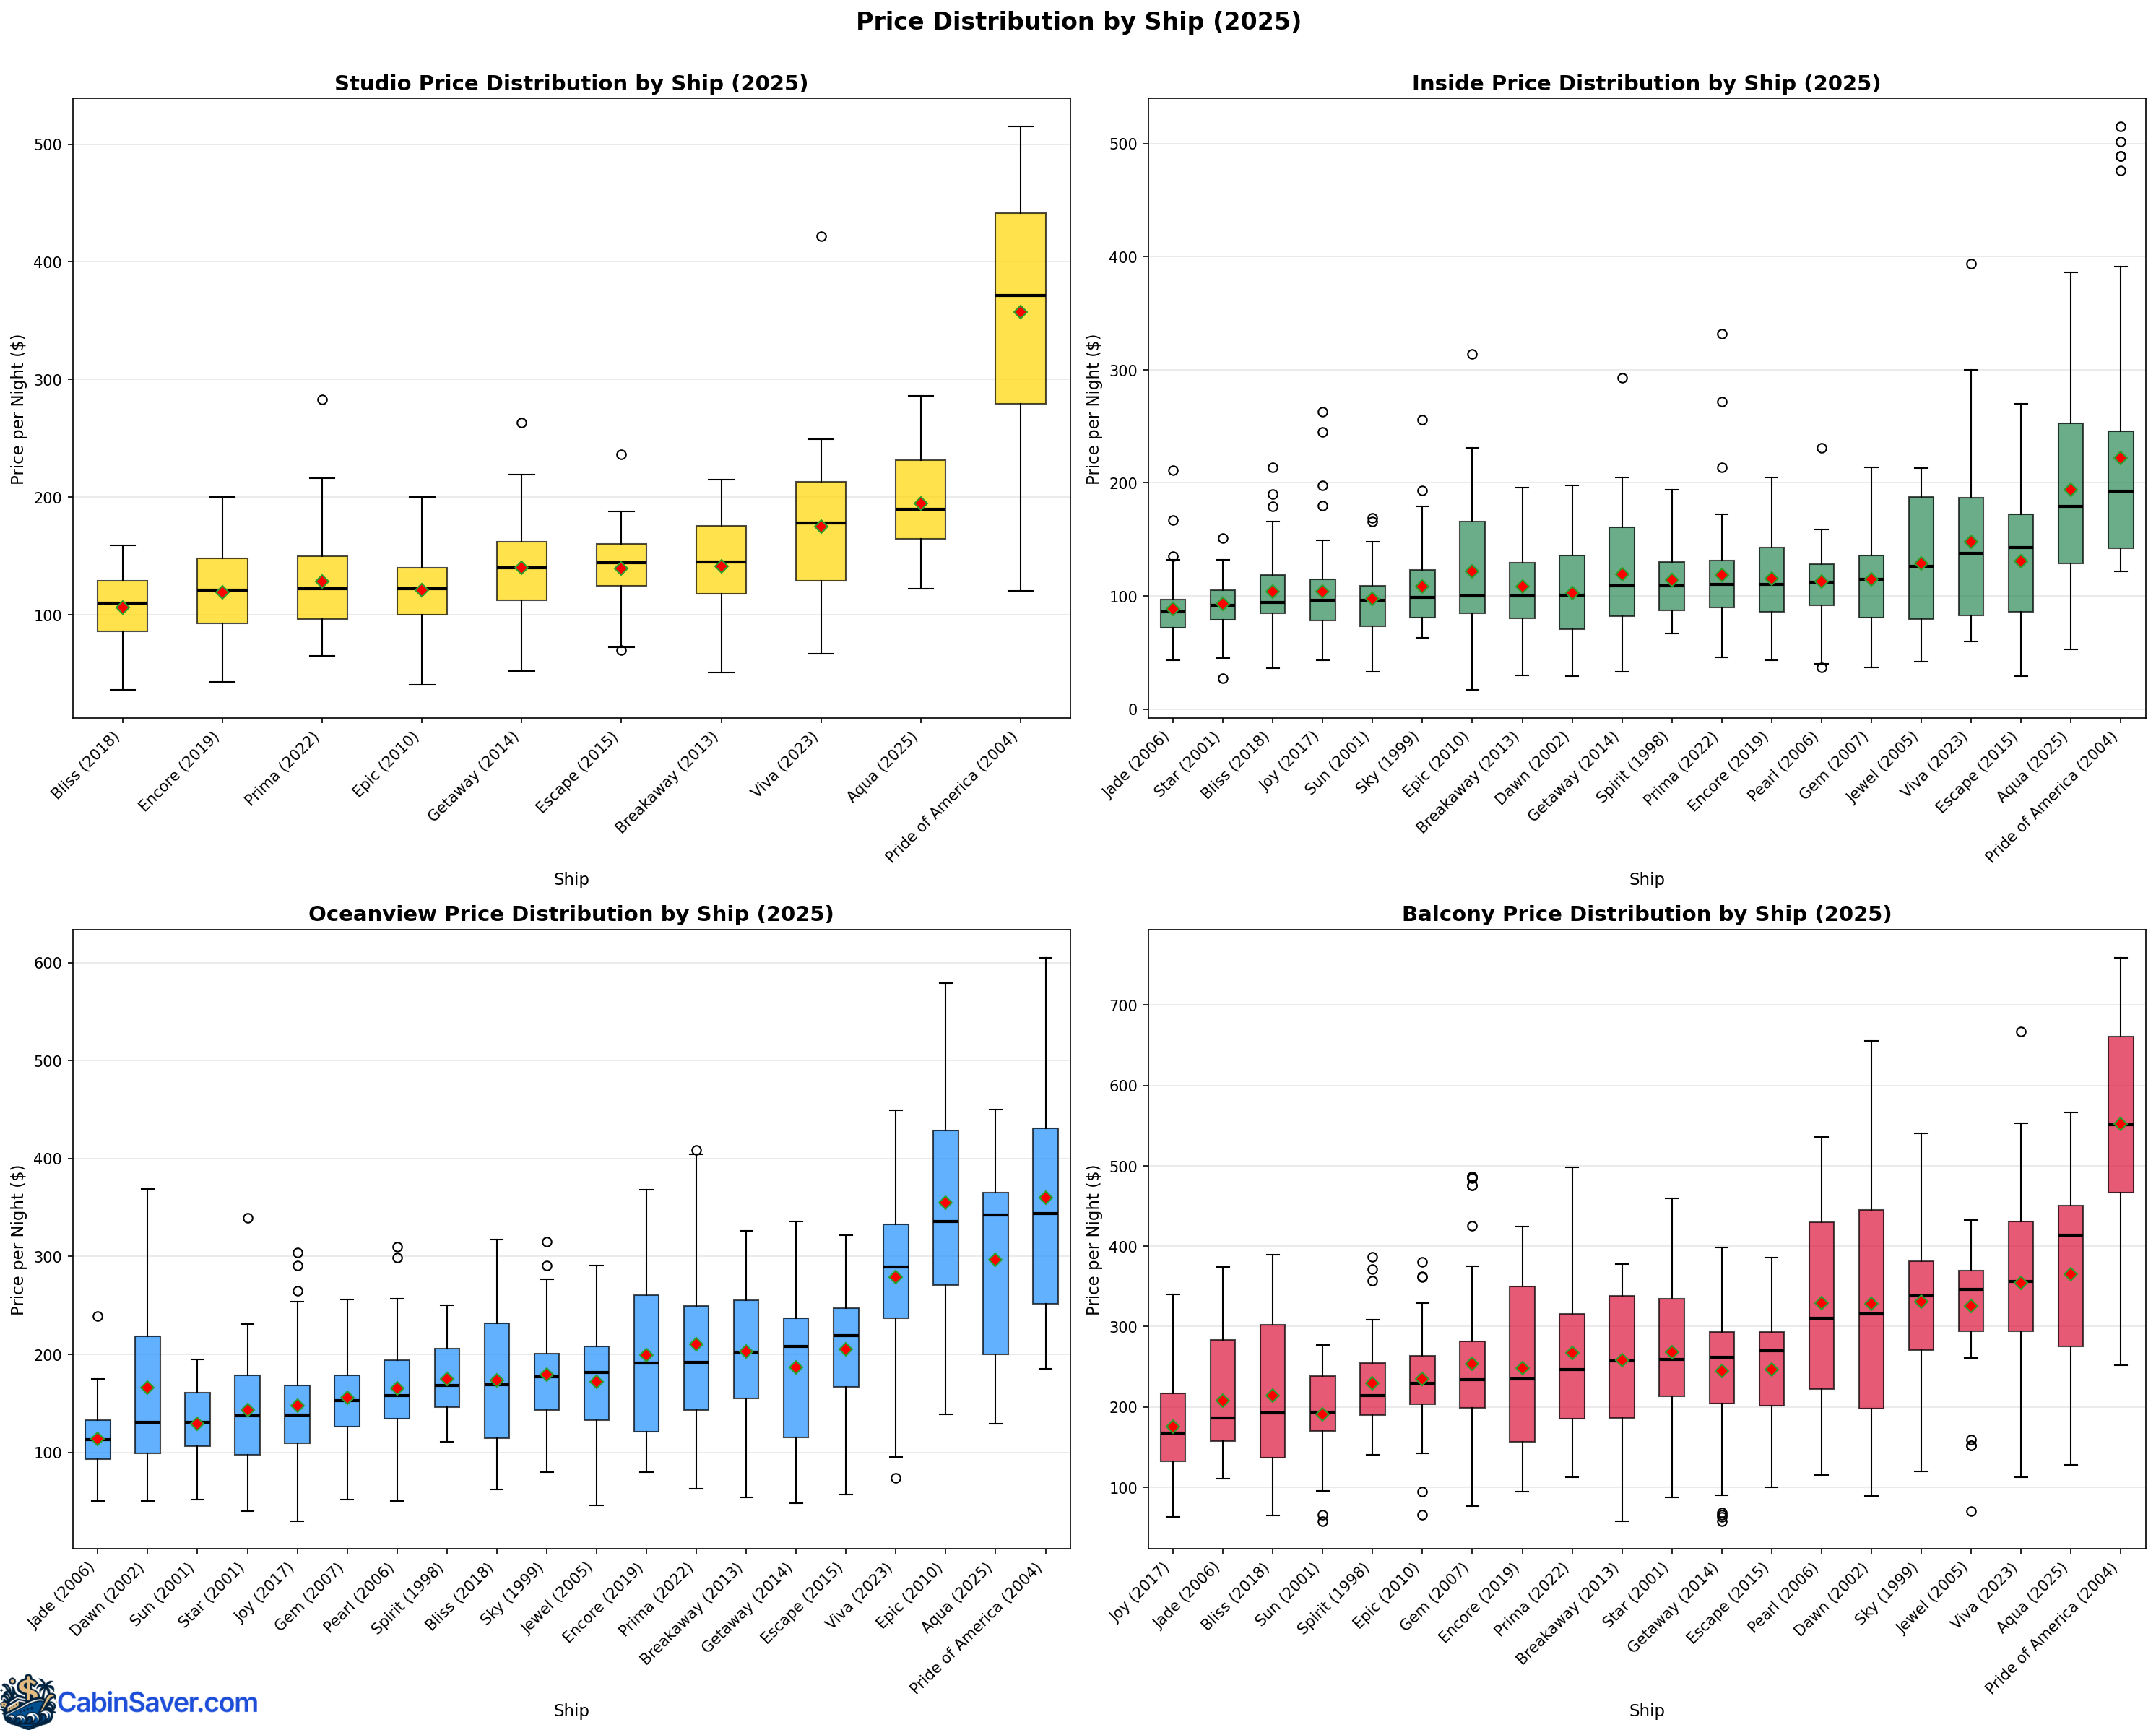
Pride of America showed the highest median prices (due to high-demand Hawaii itineraries). Newer ships like Aqua and Viva also generally resulted in premium pricing. Bliss, Encore, and Prima offered budget-friendly options.
Pricing by round-trip & one-way sailings
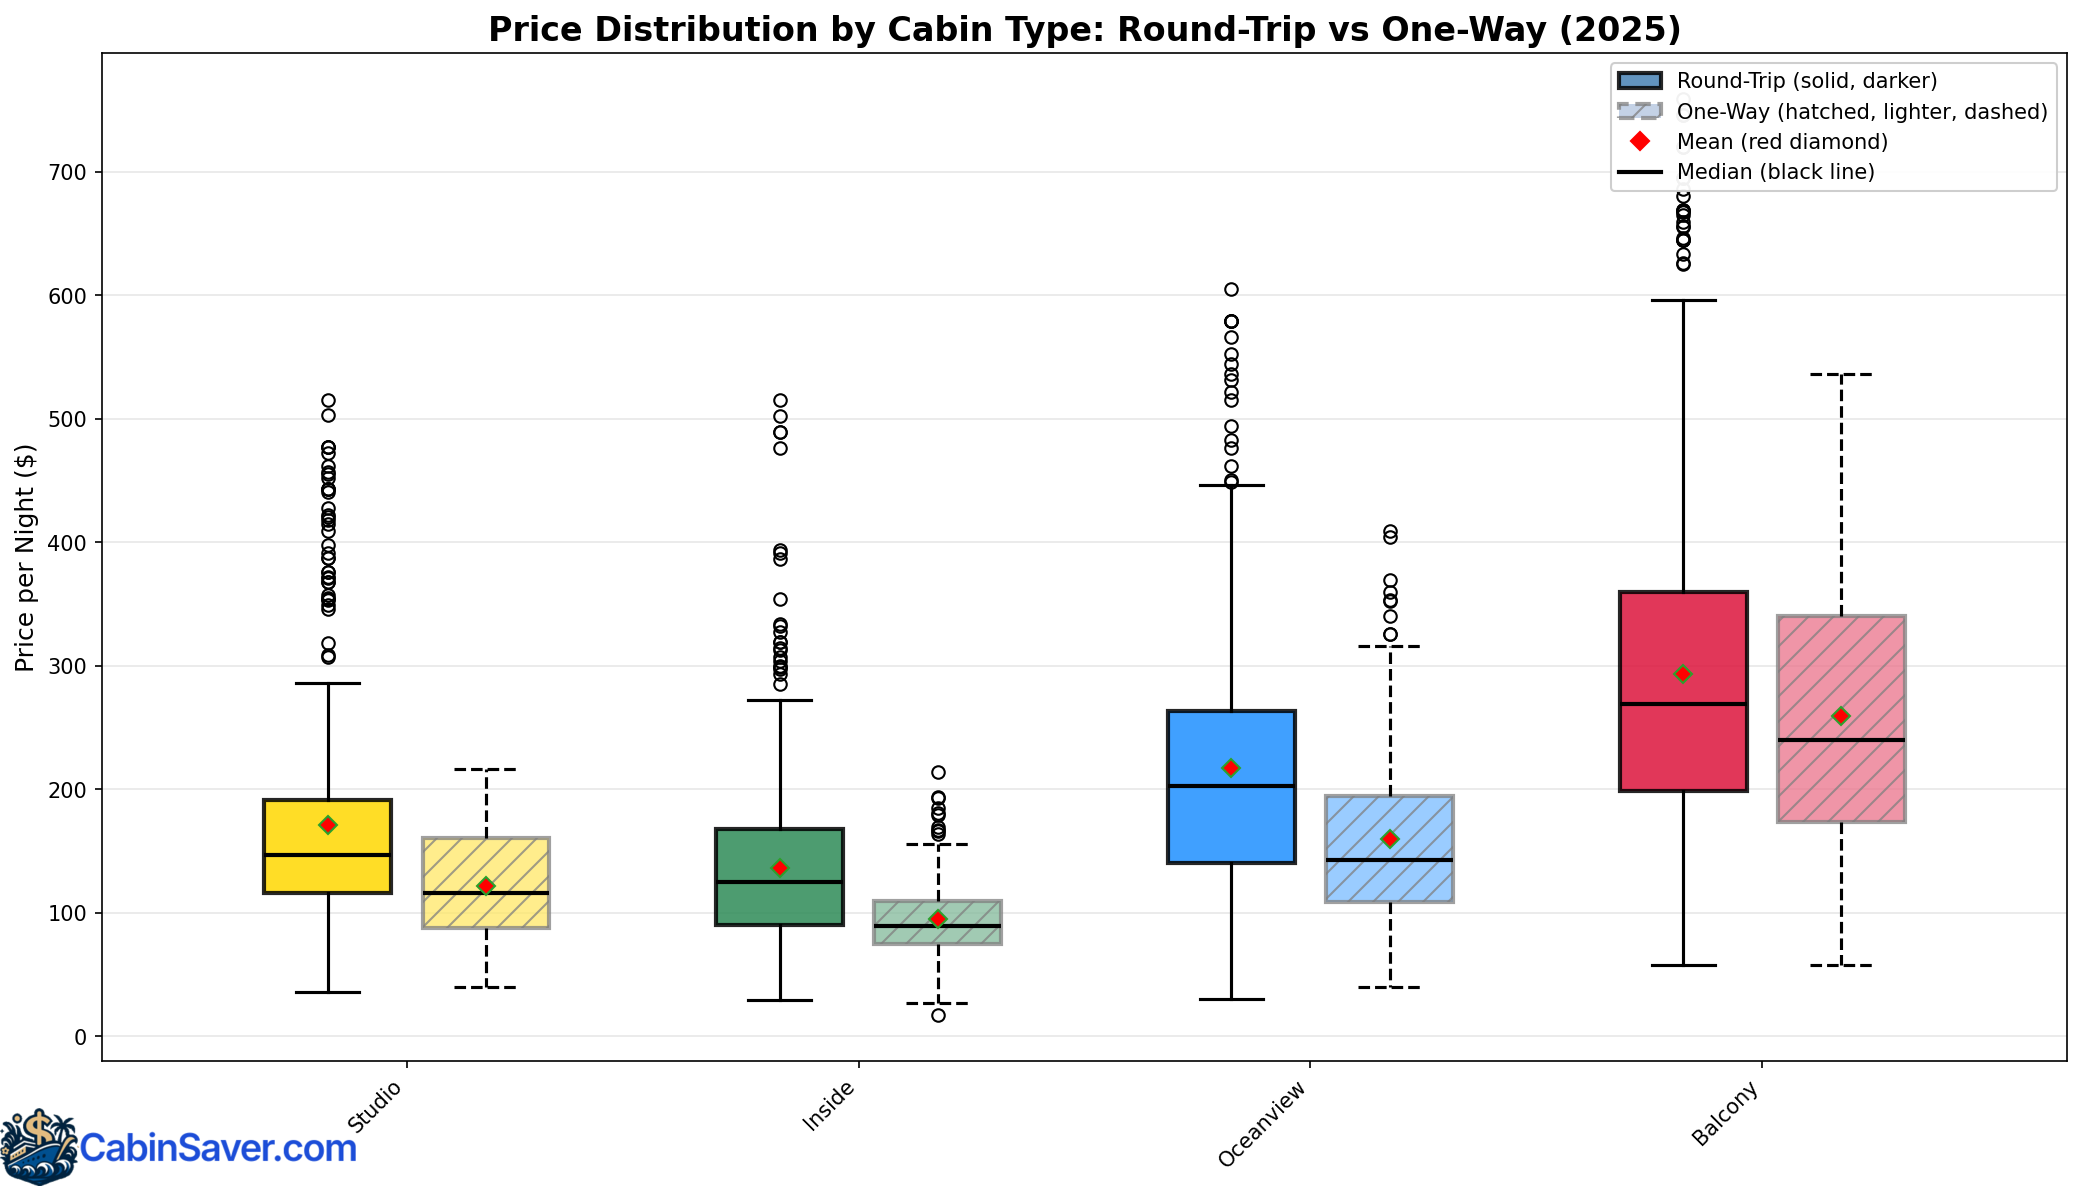
Round-trip sailings tended to be more expensive than one-way sailings. If you are used to taking cruises out of your home port, be aware that while one-way sailings offered better prices, they typically require airfare to/from the embarkation/disembarkation port.
Pricing distribution of round-trip & one-way sailings
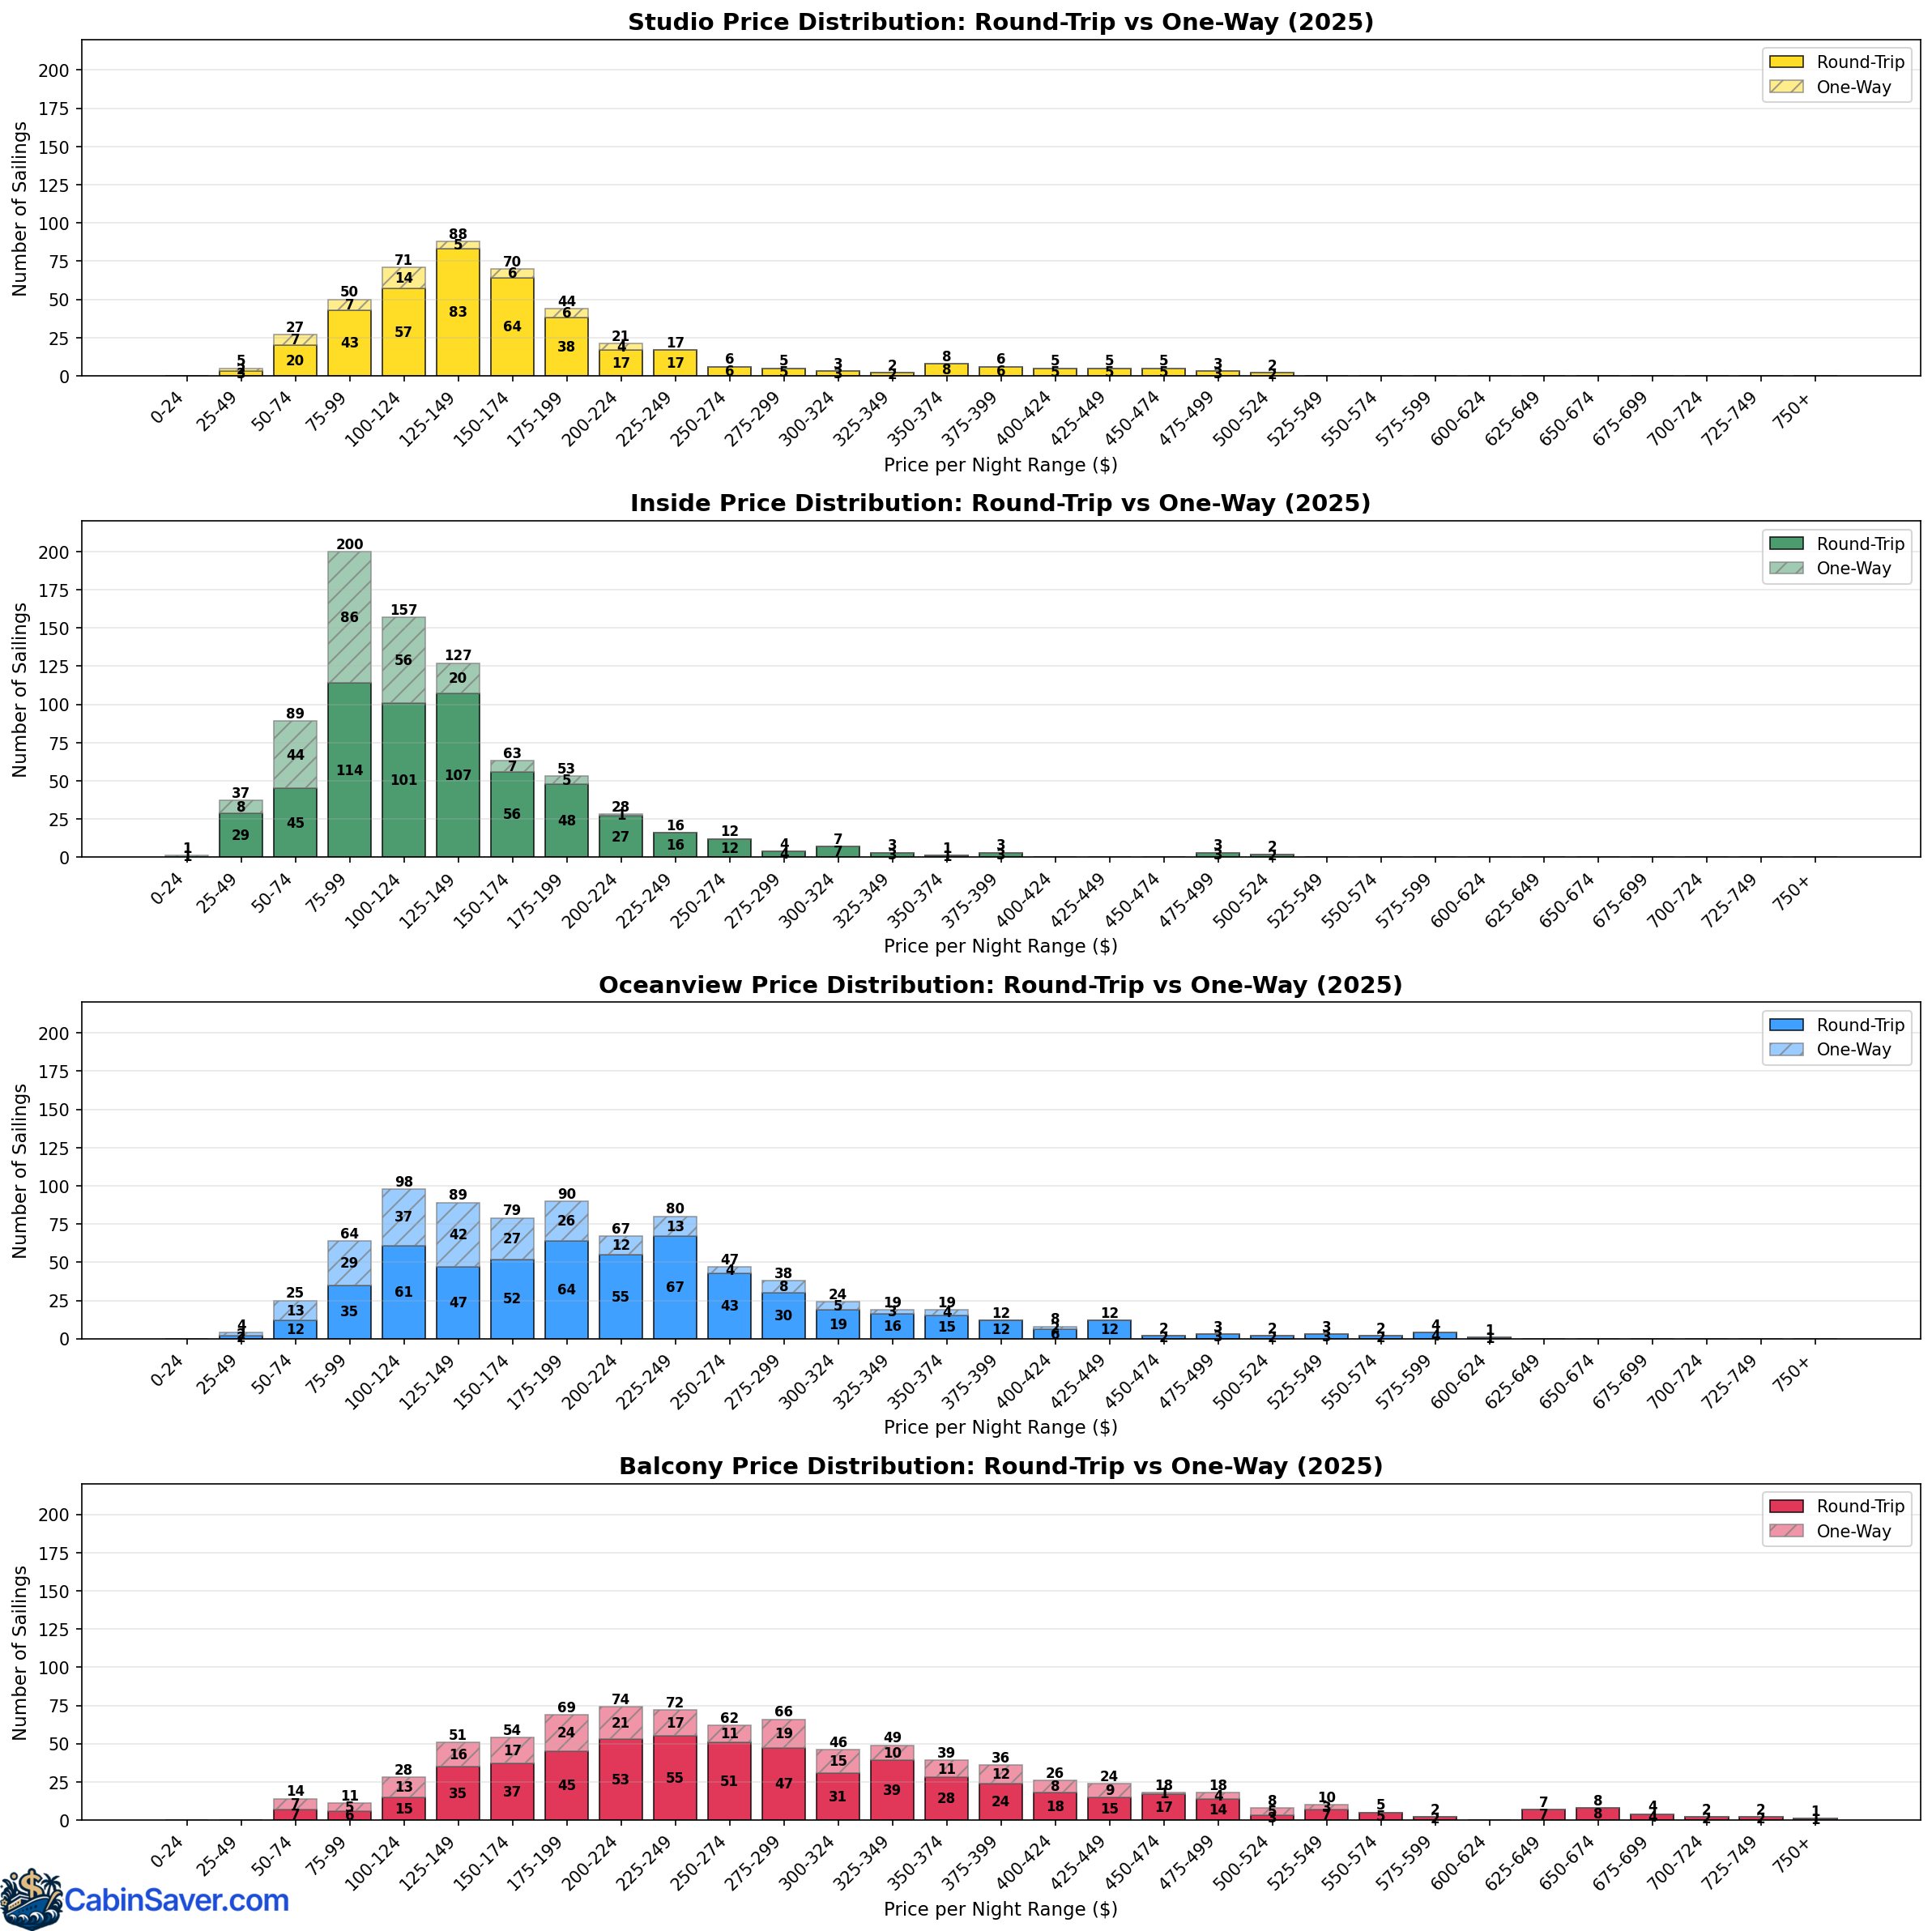
Studio cabins were often more expensive than inside cabins.
Some of the long tail of expensive cabins were due to:
- Hawaiian sailings in May (around $515, $500, $605, $759 per cabin type per night!)
- European sailings in late Summer/early Fall
- Aqua Caribbean sailings during the December holiday
Days-before-sailing booking windows that offered the lowest prices
In this section, the "booking window" is defined as the number of days before the departure date that the lowest price was found. While conventional wisdom suggests booking far in advance, the data revealed otherwise. While it's nice to get great deals, timing your booking for the best prices is a risk; the longer you wait to book, the less likely you'll get your desired cabin on a sailing you're interested in.
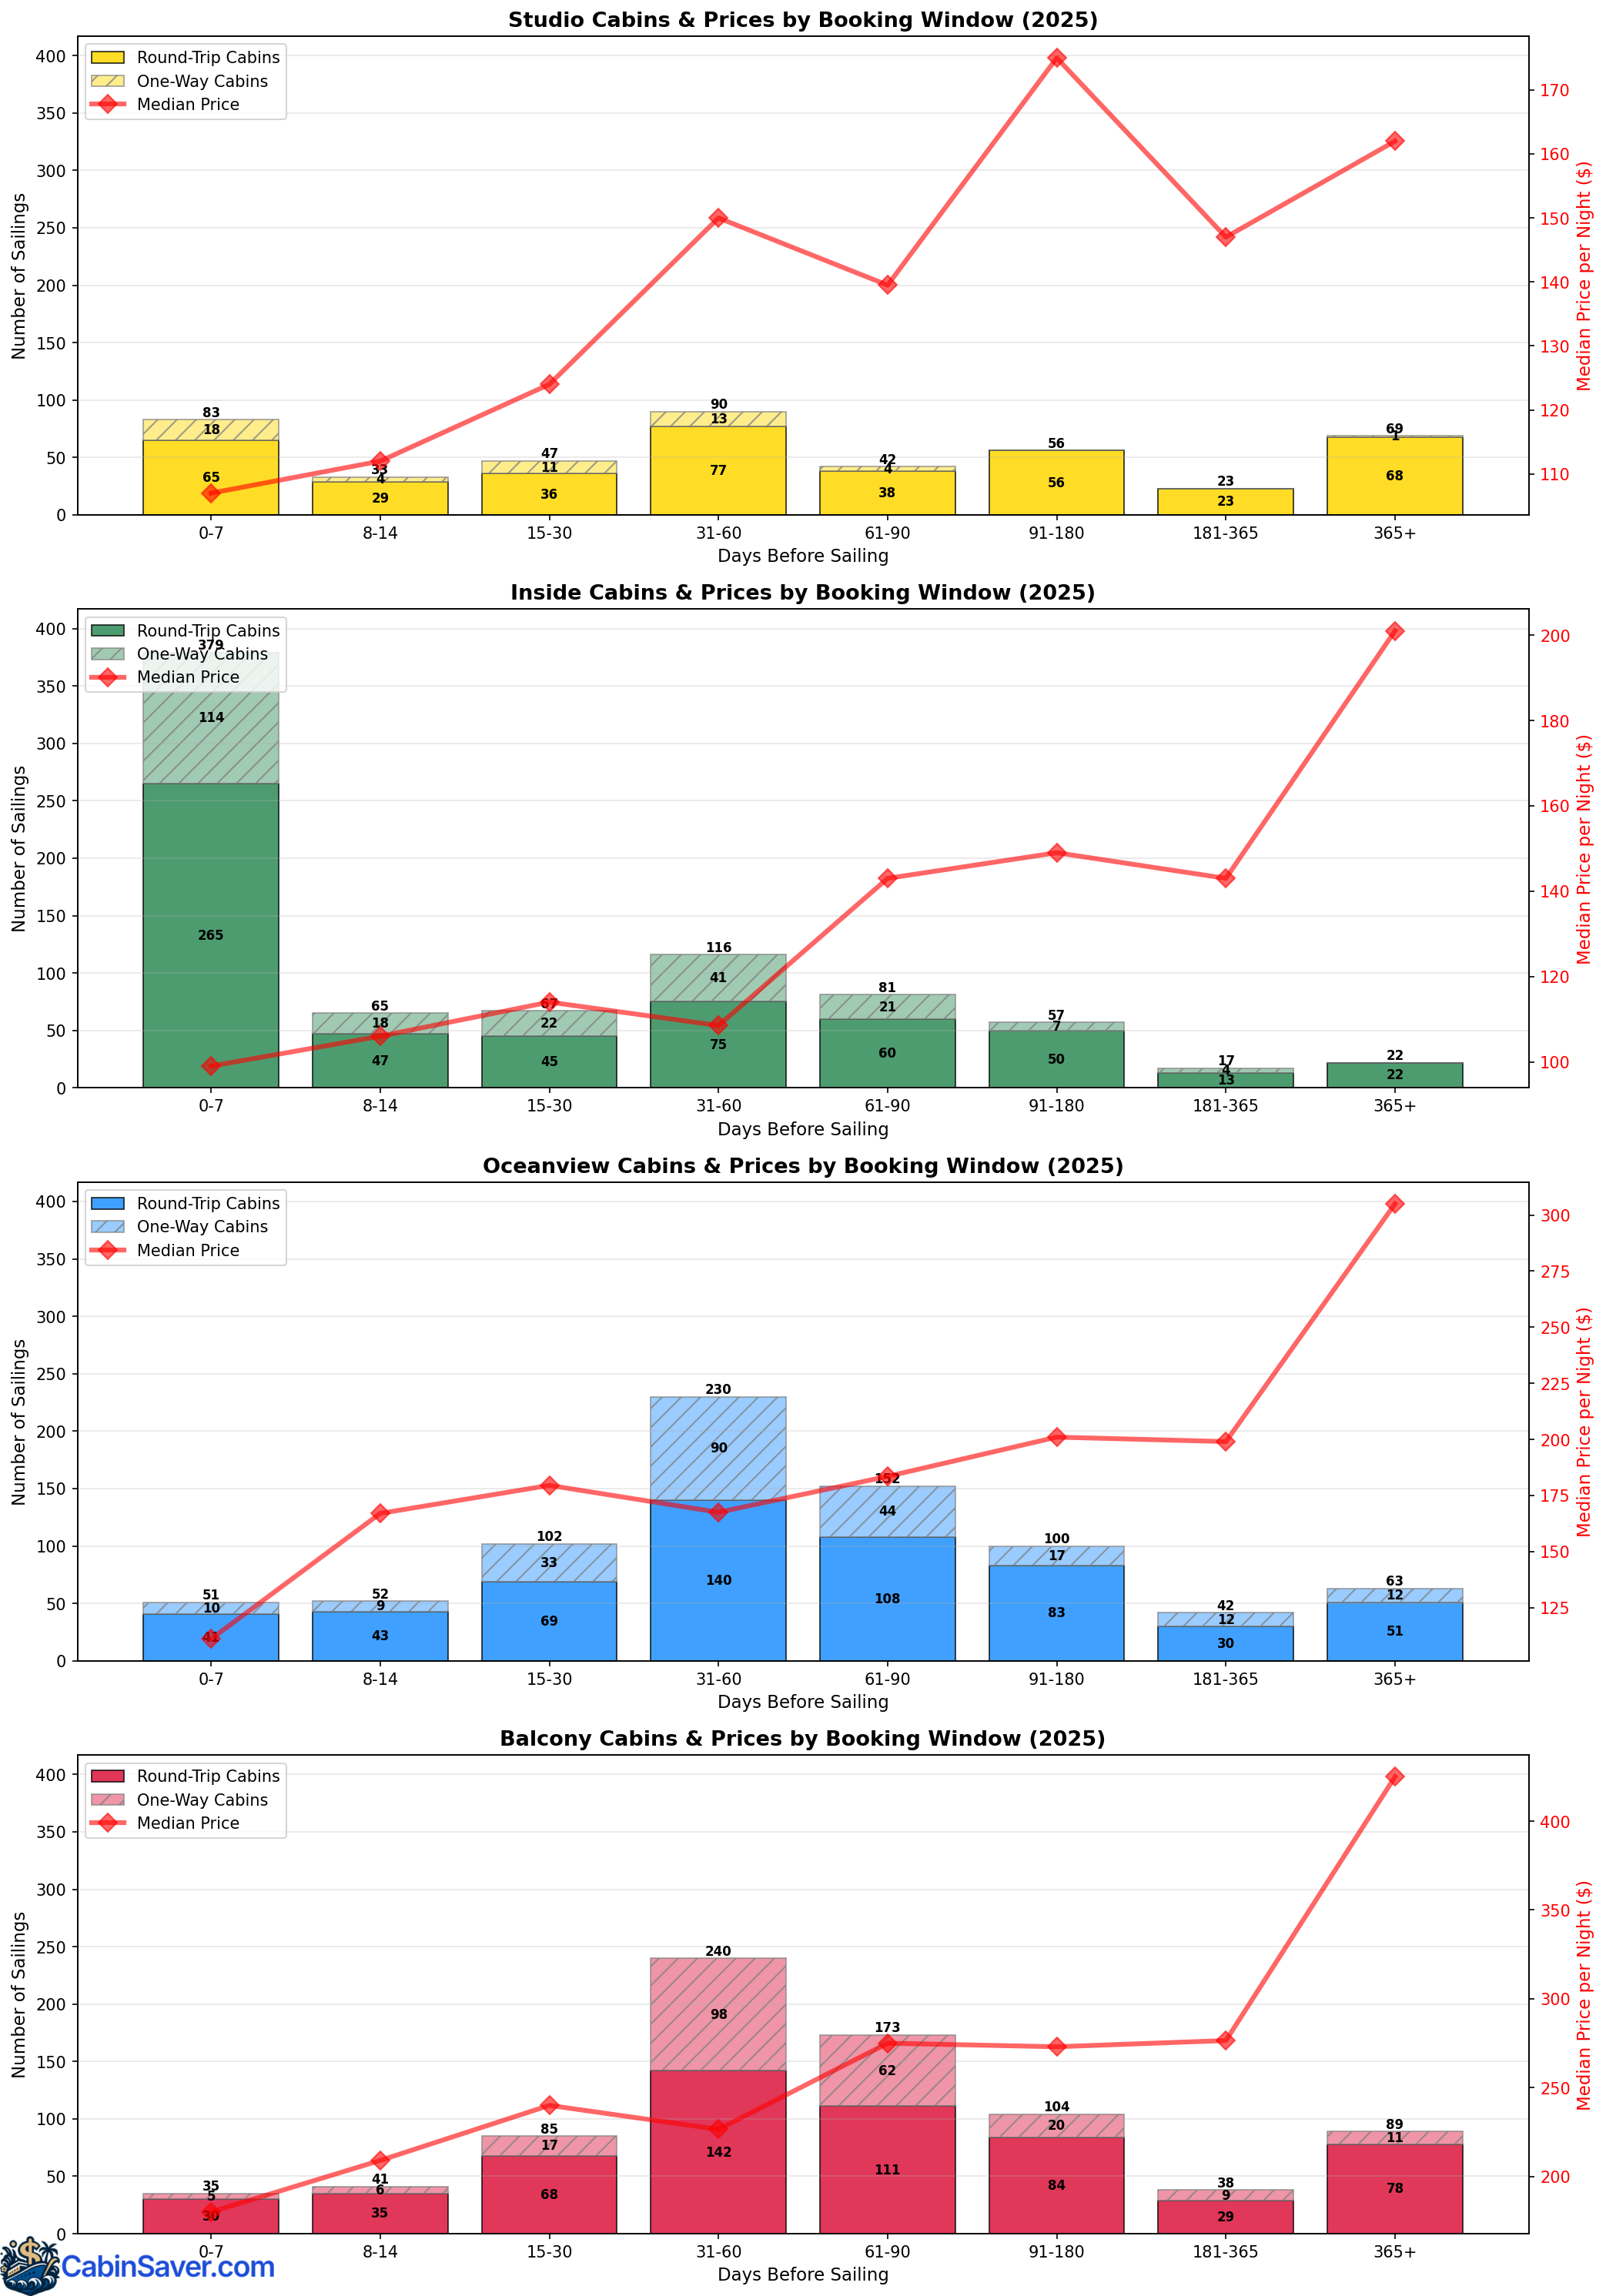
Inside cabins typically had the lowest price within 7 days of sailing while oceanview and balcony cabins commonly revealed their lowest prices between 31 and 90 days before sailing. Studio cabins didn't show much of a pattern for best-time-to-book.
Sailing durations
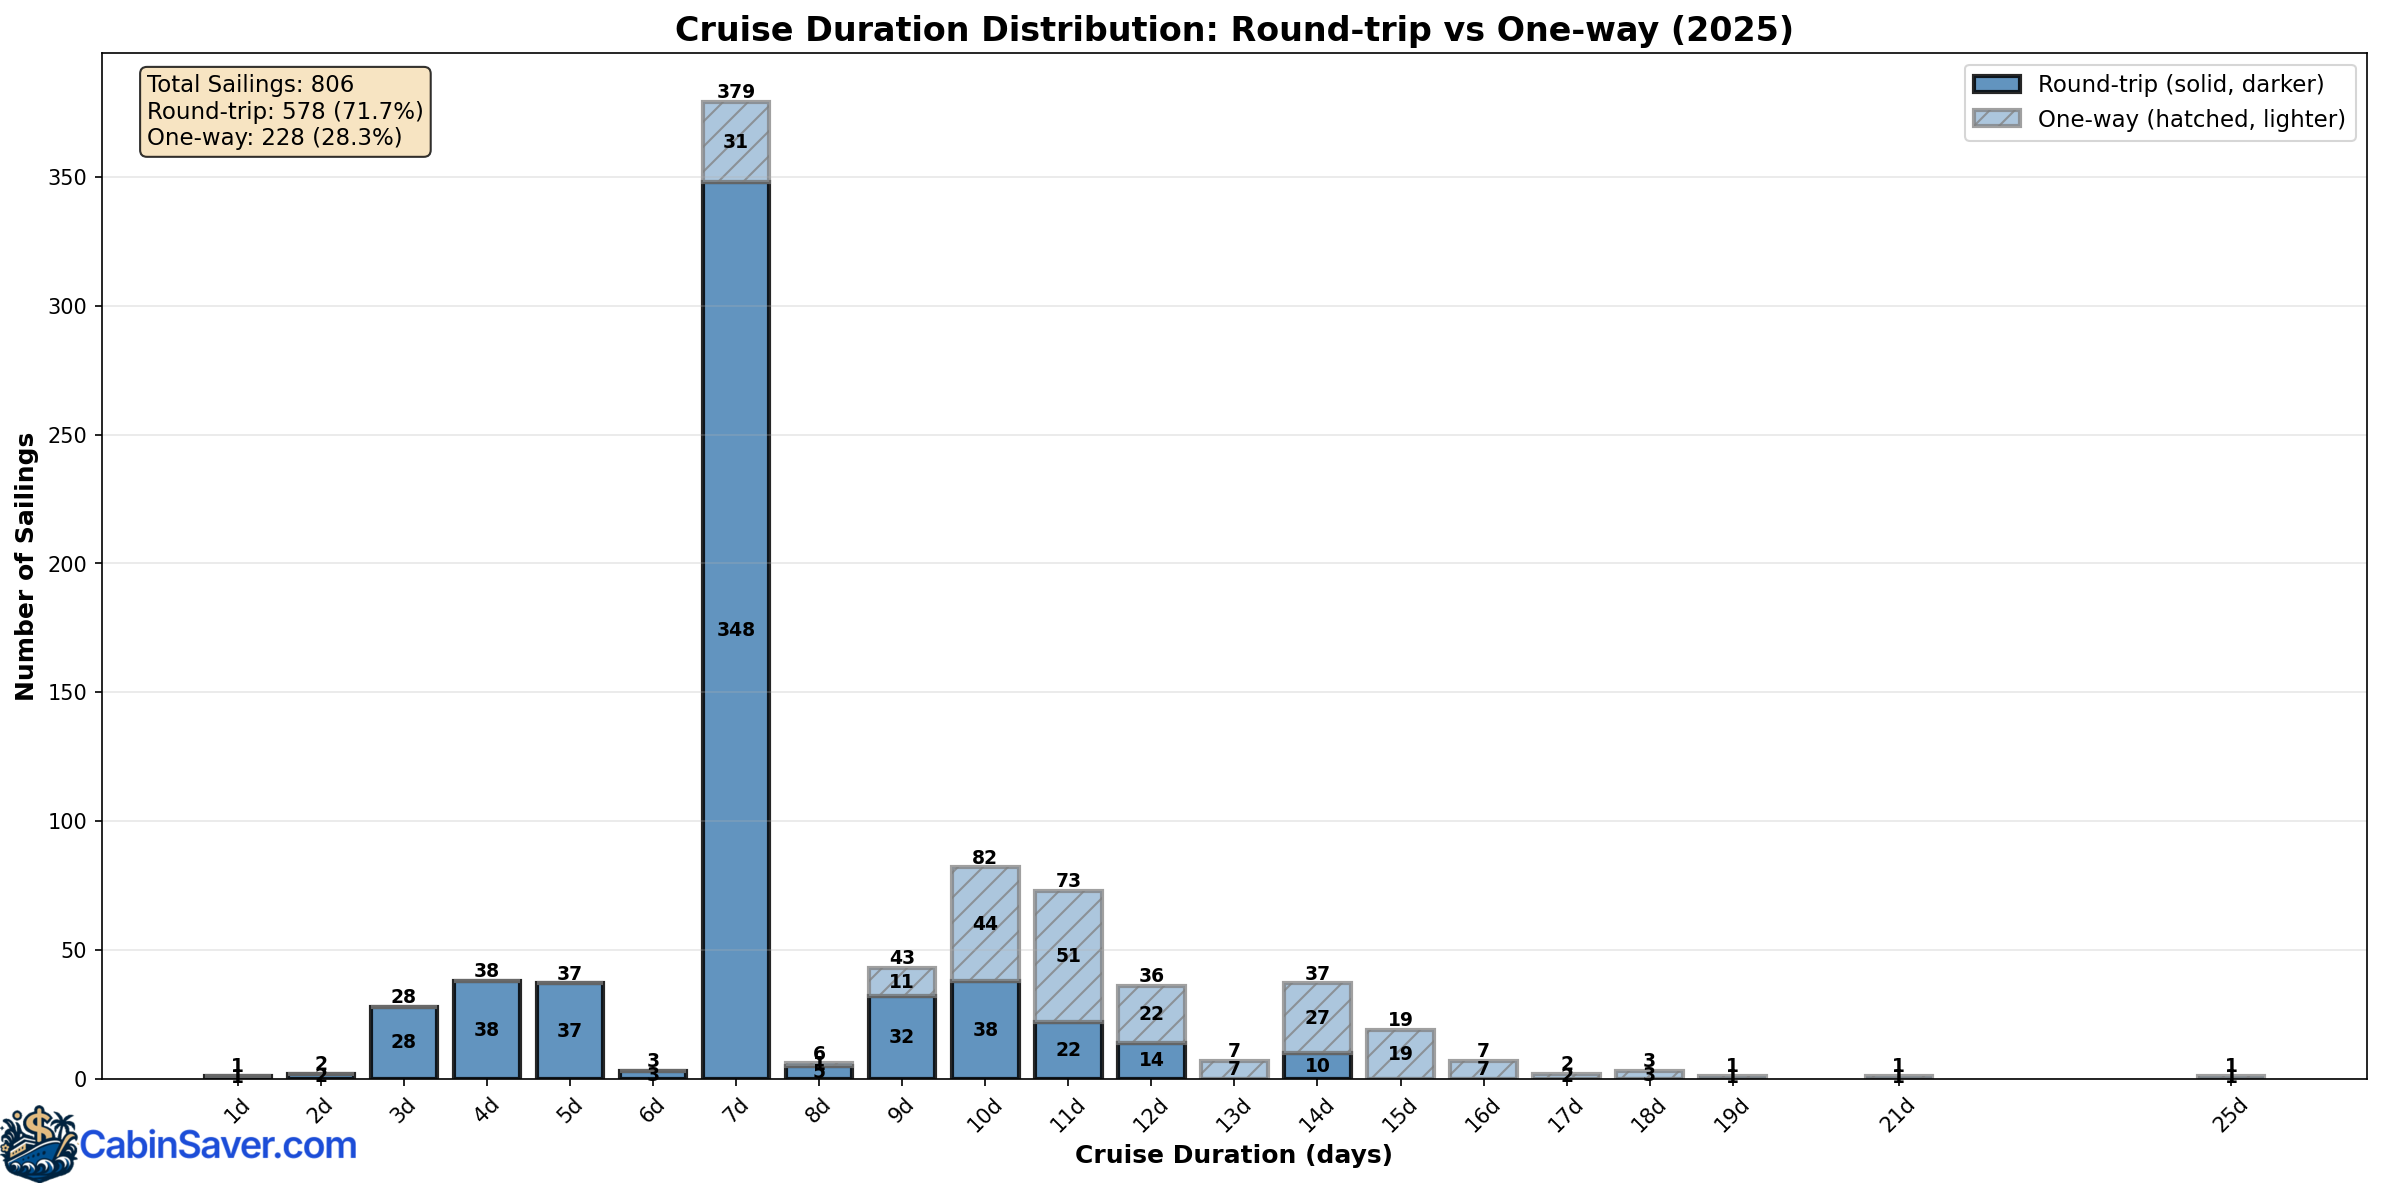
7 days was the most common sailing duration in 2025. The shorter the duration, the more likely a sailing will be round-trip.
Sailing durations by destination
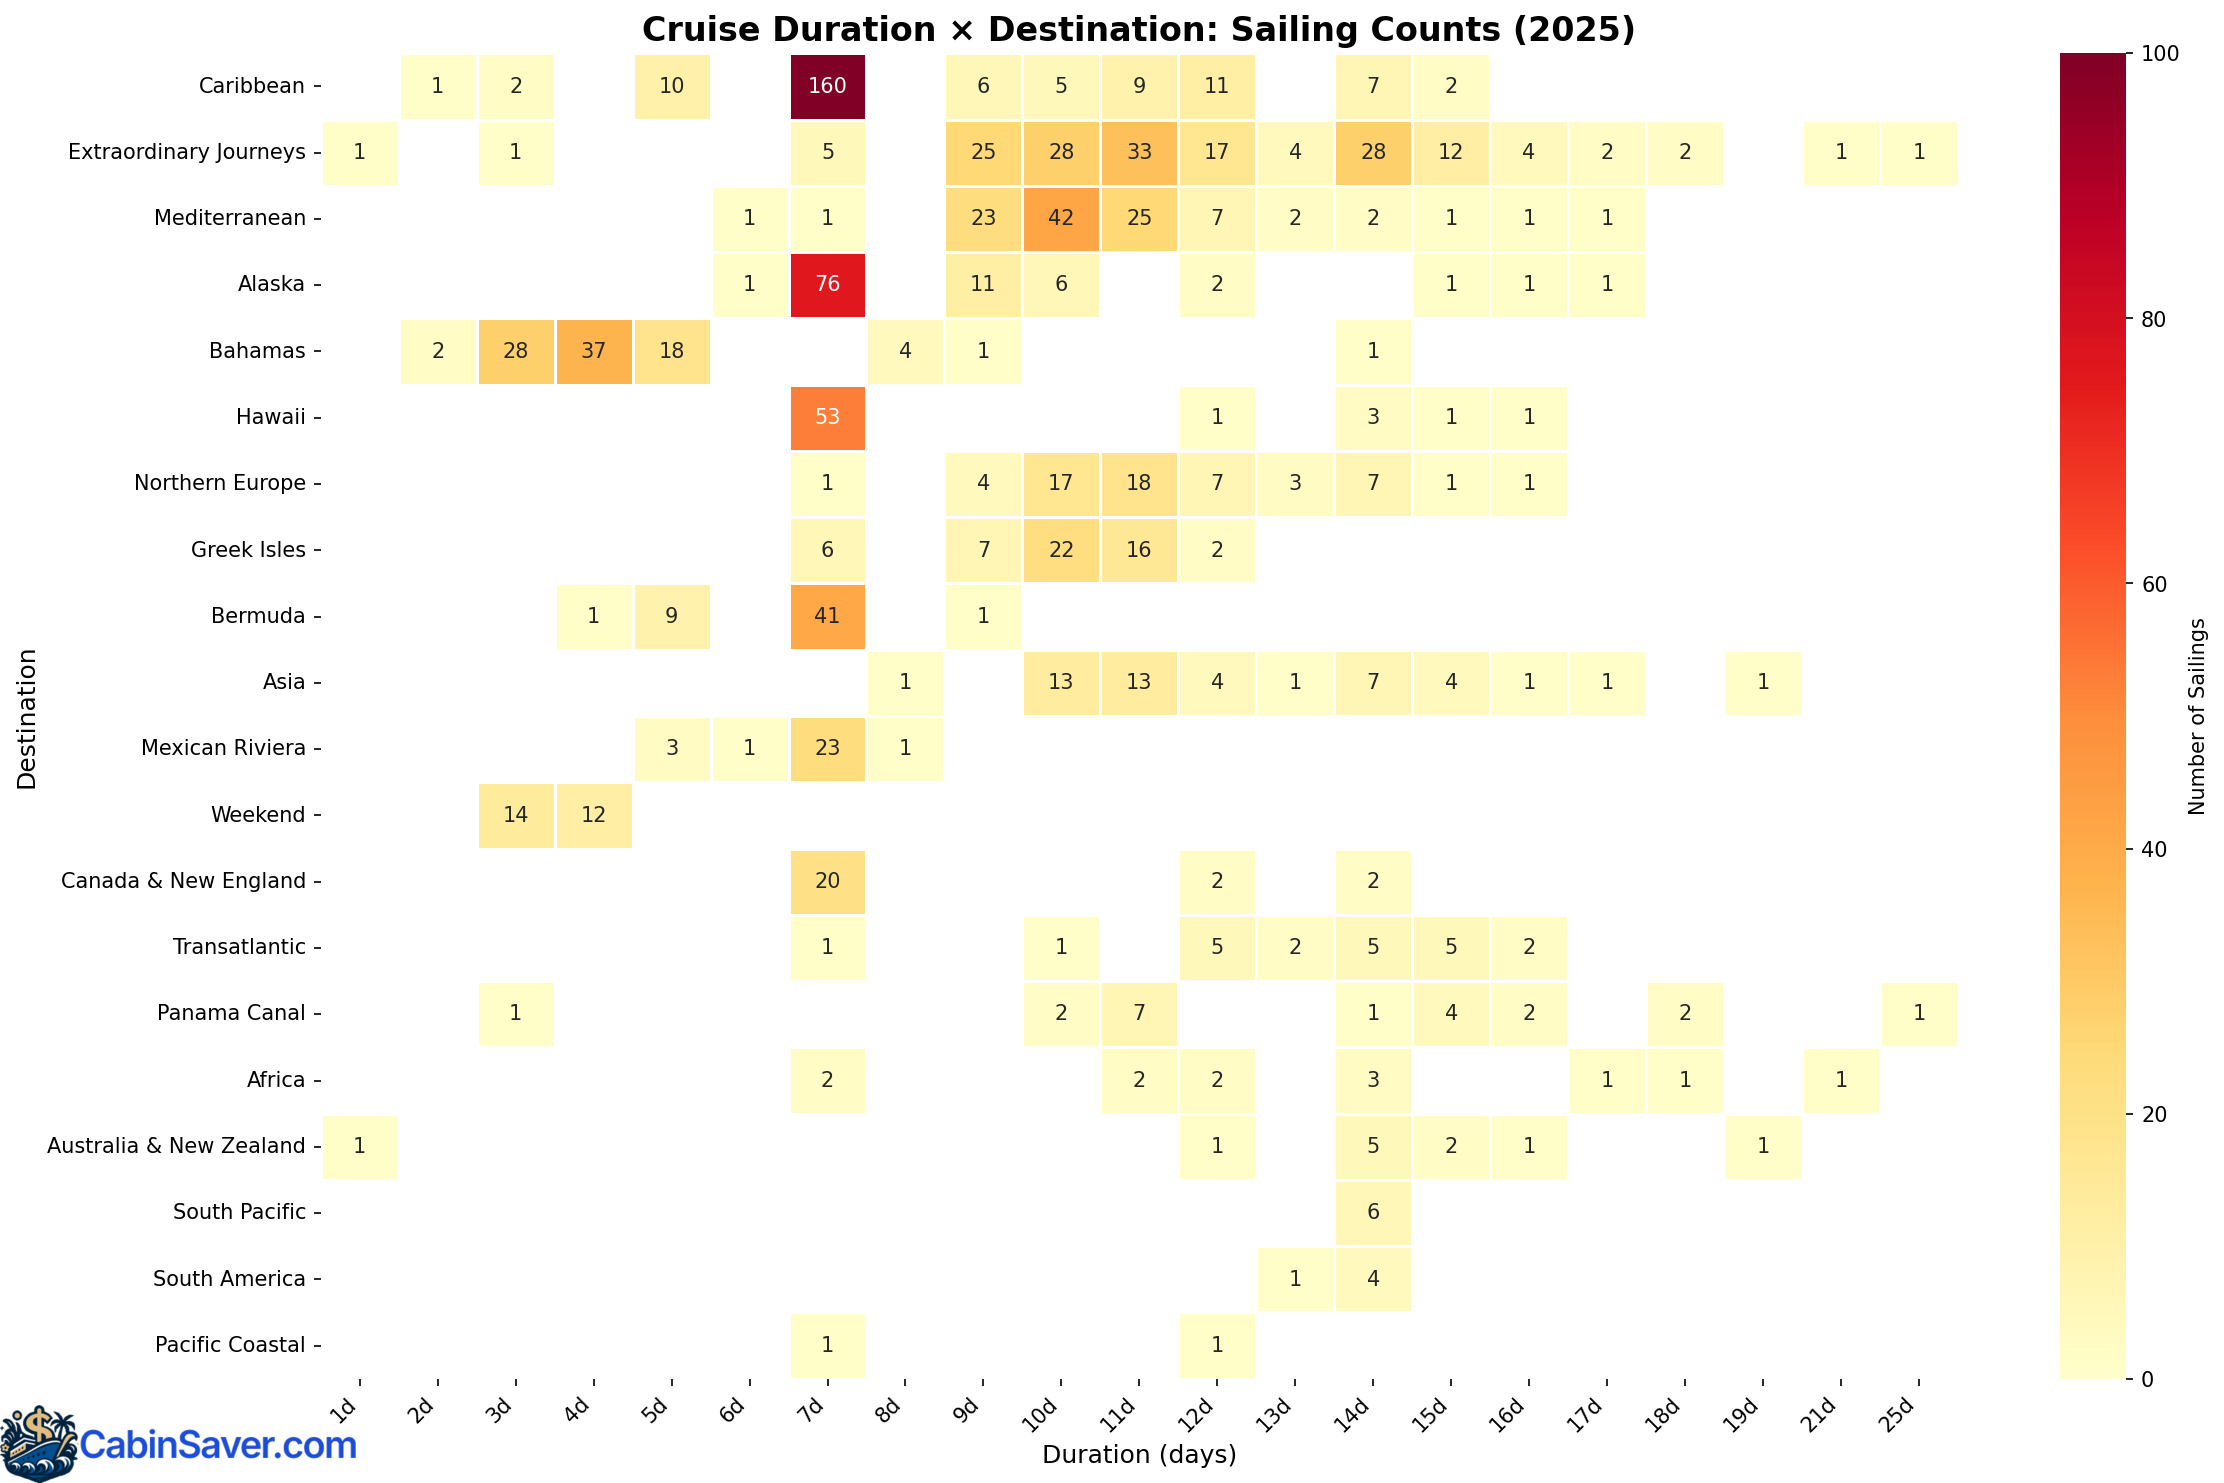
Many Caribbean, Alaskan, Hawaiian, and Bermuda sailings were 7 days long, departing from Florida, Seattle, Honolulu, and New York, respectively. European, Mediterranean, and Asian sailings tended to be between 10 and 11 days long.
Sailing durations by embarkation port
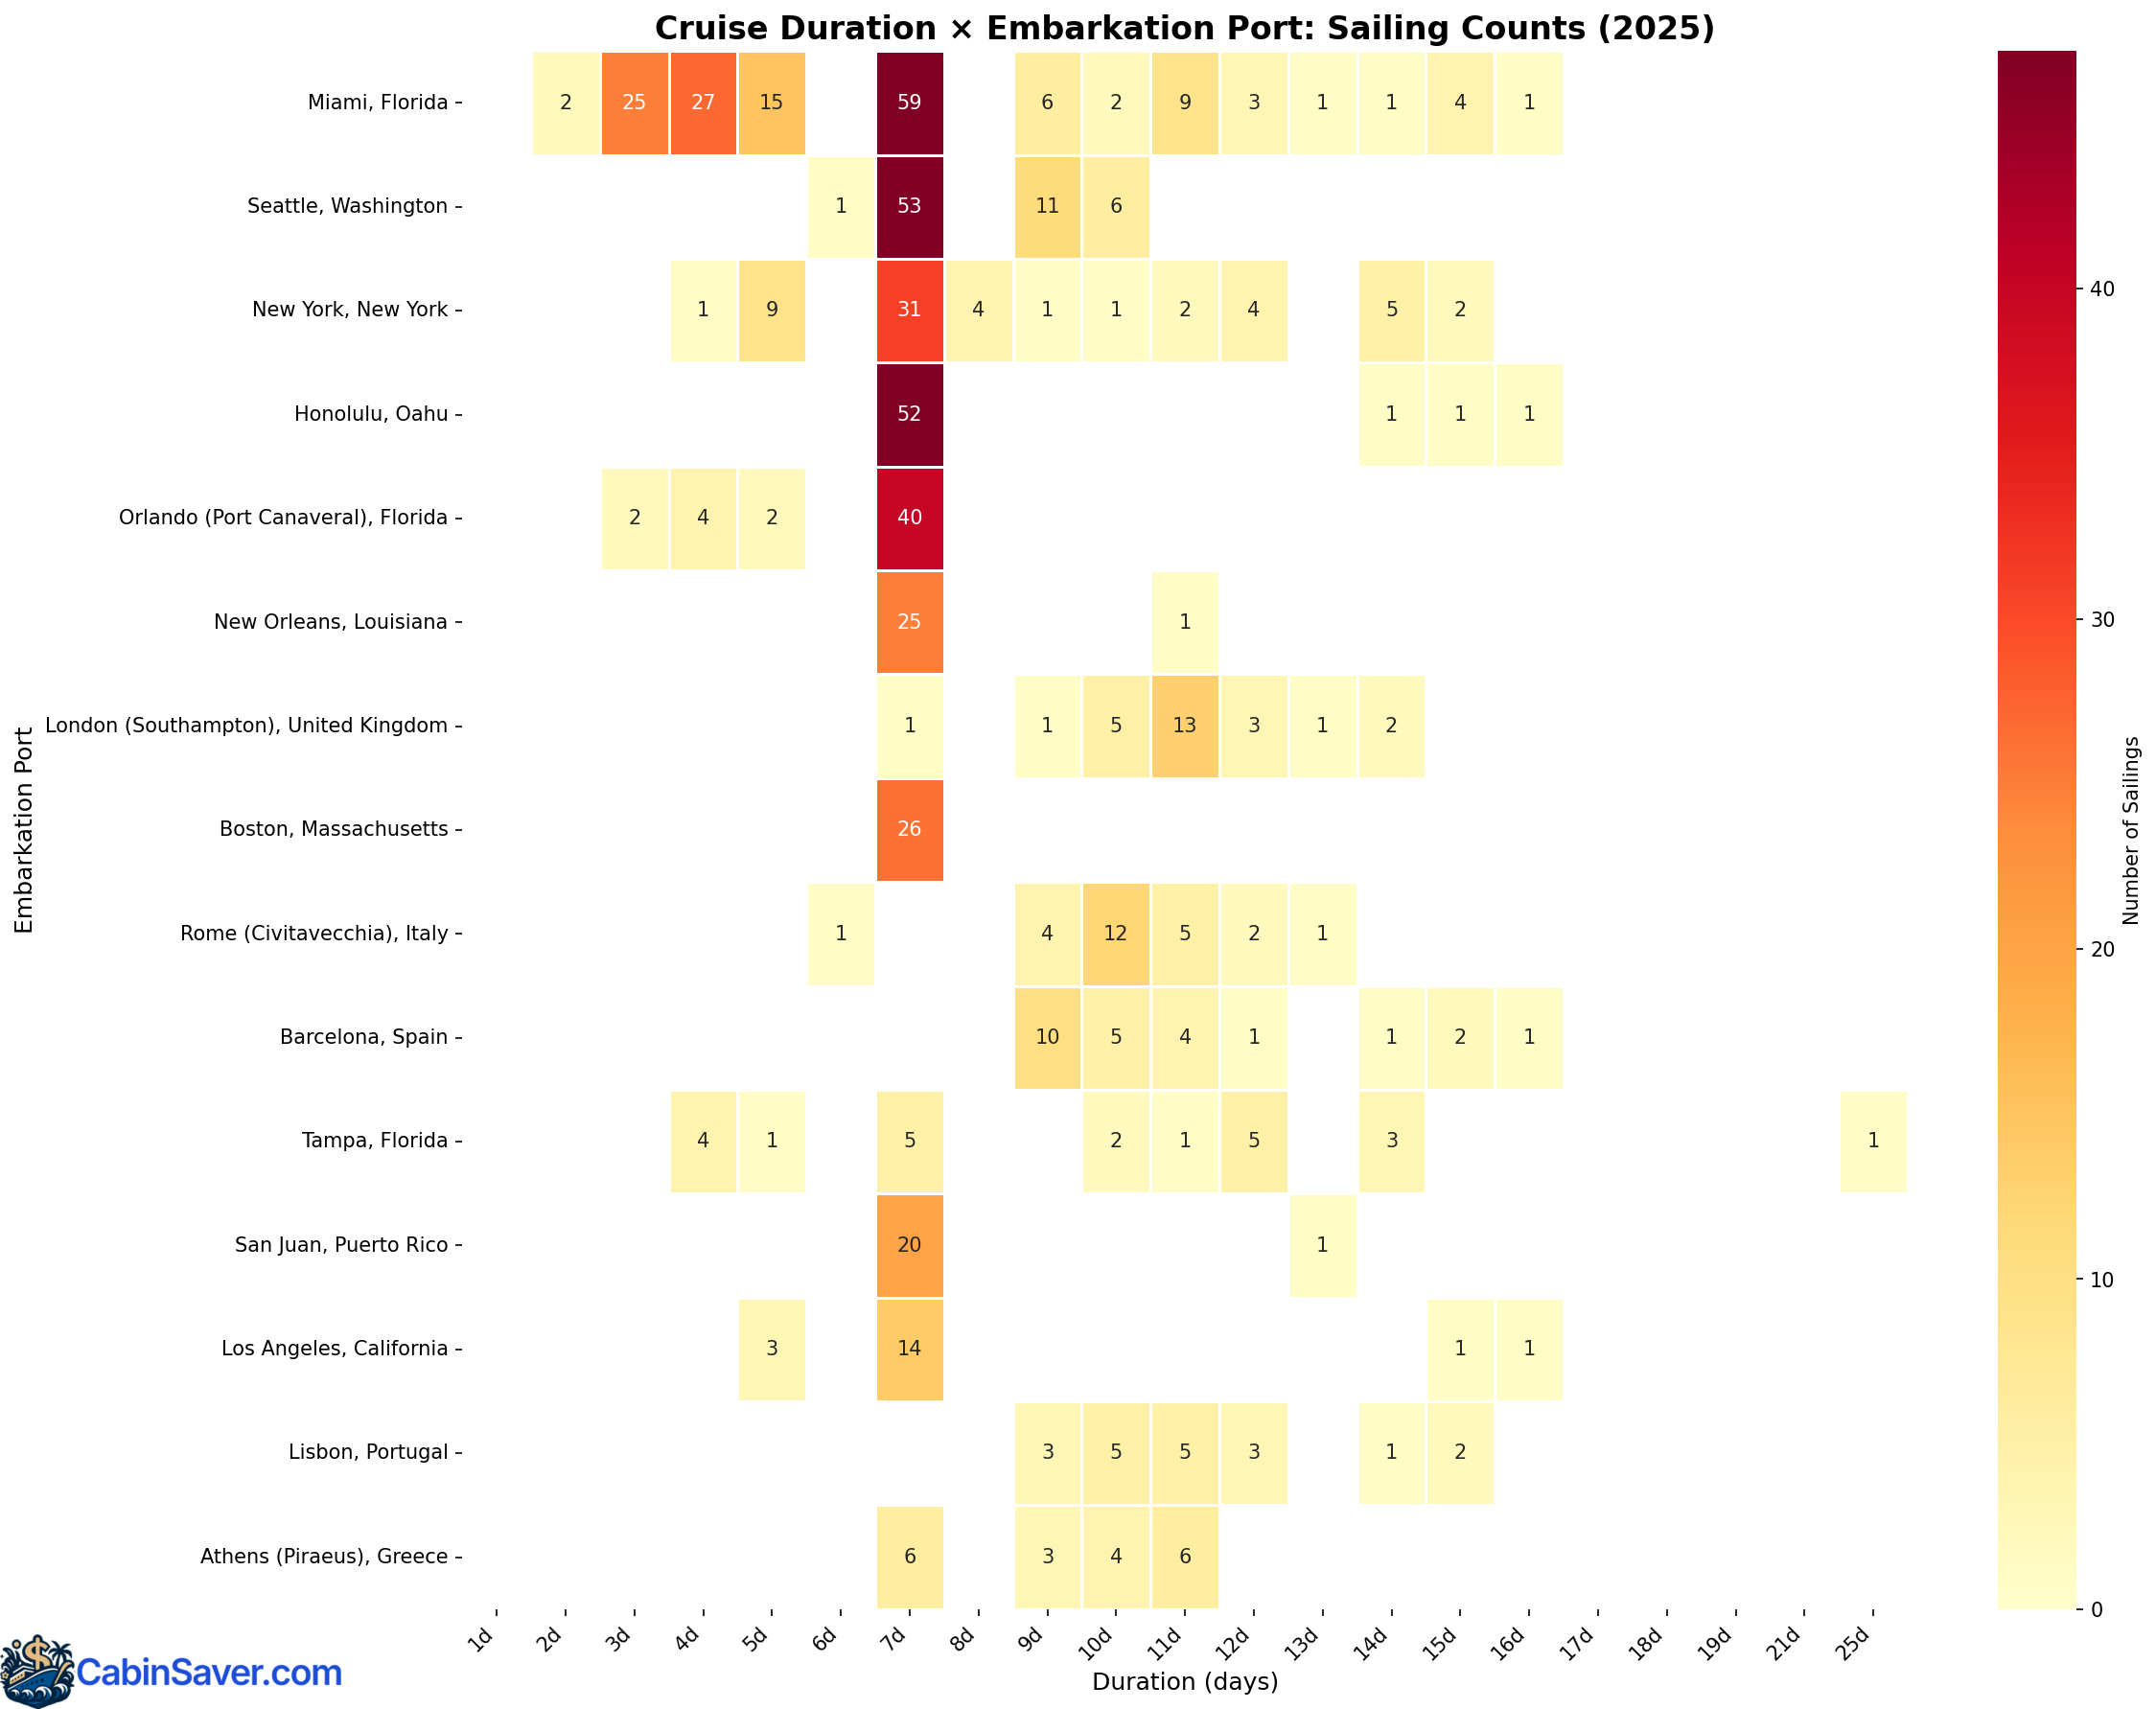
Most embarkation ports commonly offered 7-day sailings. Miami offered many 3-4 day short getaways.
Conclusion
That's all the charts I have to share for now! I hope you found this article interesting and that the insights help in your future cruise planning.
If you have any questions, concerns, or ideas for additional charts, feel free to reach out to me at MikeQDev (at) gmail (dot) com.
If you're interested in cruise deals, feel free to check out my main website at cabinsaver.com.
FAQ
When was the cheapest time to book a cruise in 2025?
Based on 2025 NCL data analysis, the optimal booking window varied by cabin type. Inside cabins typically had their lowest prices within 7 days of sailing, while oceanview and balcony cabins commonly revealed their lowest prices between 31-90 days before sailing. Contrary to common advice about booking far in advance, prices actually spiked significantly for bookings made 365+ days before departure.
For the cheapest month to sail, November offered the lowest median prices across all cabin types, ranging from $70-175 per night. Fall months generally offered better value for budget-conscious cruisers.
What were the most popular cruise destinations in 2025?
Based on NCL 2025 sailing data, the Caribbean led as the most popular destination with 213 sailings throughout 2025, followed by the Mediterranean with 106 sailings, and Alaska with 99 sailings. The Bahamas and Hawaiian islands also saw significant sailing volume.
Caribbean cruises were available year-round with 7-day itineraries being most common, while Alaska cruises concentrated in the May-September window, and Mediterranean sailings peaked during European summer months (June-August).
Which embarkation port had the most cruise sailings in 2025?
For Norwegian Cruise Line, Miami, Florida led with 155 sailings in 2025, making it the busiest embarkation port. Miami primarily served Caribbean and Bahamas itineraries with a median 7-day duration.
Seattle, Washington followed with 71 sailings, almost exclusively serving Alaska cruises during the summer season. New York ranked third with 60 sailings offering diverse destinations including Caribbean, Bermuda, and Transatlantic routes.
What was the optimal booking window for cruises in 2025?
Based on 2025 NCL data, the optimal booking window varied by cabin type:
- Inside cabins: Lowest prices typically within 7 days of sailing
- Oceanview and balcony cabins: Lowest prices commonly between 31-90 days before departure
- Most cabins were available 31-60 days before sailing with competitive pricing and good selection
Booking 365+ days in advance showed sharply rising median prices in this window. Last-minute bookings (0-7 days) could offer deals for inside cabins but showed unpredictable pricing and very limited availability for other cabin types.
Were round-trip or one-way cruises cheaper in 2025?
In 2025 NCL data, one-way sailings generally showed slightly lower median prices compared to round-trip options, particularly in the oceanview and balcony cabin categories. However, the difference was typically modest.
Round-trip cruises accounted for 71.7% of all sailings (578 vs 228 one-way), offering more options and the convenience of departing from and returning to the same port—potentially saving on airfare and ground transportation.
When choosing between them, travelers needed to consider total travel costs including flights, as the savings from a one-way cruise could be offset by additional airfare costs for different departure and arrival cities.
When did cruise prices peak in 2025?
For Norwegian Cruise Line, August saw the highest median prices across all cabin types, with balcony cabins reaching $370+ per night. This peak corresponded with:
- Summer vacation season (high family travel demand)
- Alaska cruise season at its height
- European/Mediterranean cruises in peak season
July and late June also showed elevated pricing. To avoid peak pricing, sailing in November offered the best deals.